Contents
AcademyMeta Analysis
Guide
How to Read a Forest Plot: An Annotated Worked Example from a Meta-Analysis
A forest plot summarises individual study results and their combined effect in one chart. This annotated worked example shows how to read the point estimates, confidence intervals, study weights, pooled effect and heterogeneity step by step.
- Meta-analysis
- Forest plots
- Statistics
- Square
- Study point estimate, sized by weight
- Whiskers
- 95% confidence interval
- Diamond
- Pooled effect and its interval
- Heterogeneity
- I² of about 25% low, 50% moderate, 75% high
At a glanceMeta Analysis
Talk to a Pubrica expertDiscuss your project
Quick answer
- Find the line of no effect (1.0 for ratios, 0 for differences), then read each square and its interval against it.
- An interval that crosses the line means that result is not statistically significant on its own.
- Read the diamond the same way for the pooled effect, then check I² before trusting it.
What a forest plot shows
If you have opened a systematic review and felt lost among the rows of boxes and lines, this guide on how to read a forest plot is for you. A forest plot is the signature graphic of a meta-analysis: it stacks the results of several studies on one chart and adds one combined, or pooled, result at the bottom1. Having a forest plot explained in plain language lets you see at a glance how consistent the evidence is and which way it points. Each study contributes one horizontal row, so a single chart summarises a whole body of research4.
Anatomy of the plot: axis, squares and whiskers
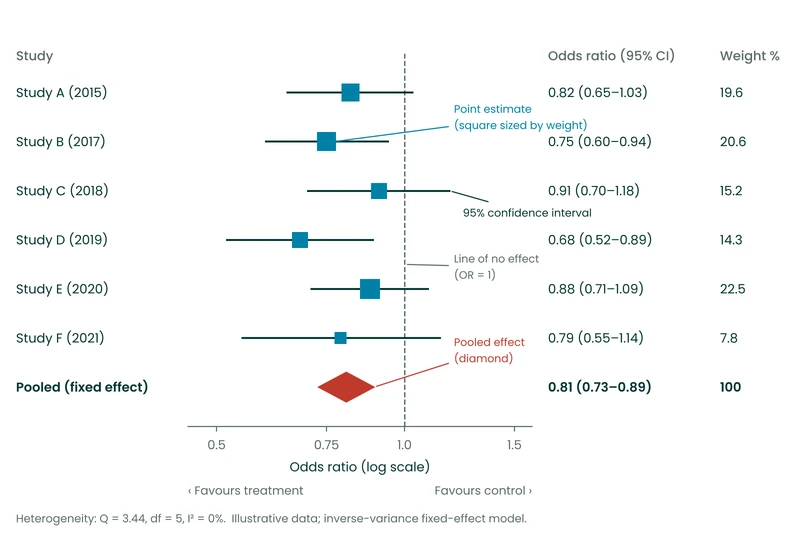
Before you interpret a forest plot, find three features. First, the vertical reference line is the line of no effect. For a ratio measure such as an odds ratio or a risk ratio it sits at 1.0; for a difference measure it sits at 0. Second, each square is a study’s point estimate, its best single-number result. The size of the square reflects the study weight, so larger, more precise studies draw a bigger box1. Third, the horizontal line through each square (its whiskers) is the 95% confidence interval. A narrow interval signals a precise estimate; a wide one signals uncertainty3.
Reading each study row
Work down the plot one row at a time and ask three questions of every study. Where does the square fall relative to the line of no effect? When the outcome is harmful, such as death or relapse, a square to the left of 1.0 favours the treatment and one to the right favours the control. Does the confidence interval cross the line of no effect? If it does, that study’s result is not statistically significant on its own. How wide is the interval? The answer tells you how much to trust the point estimate4.
In Figure 1, Study D sits furthest left, Study C straddles the line, and Study F has the widest interval and the smallest square. Learning to interpret a forest plot is largely this habit of scanning each row against the reference line.
Need help designing, running or reporting your meta-analysis?
Pubrica’s biostatistics and medical-writing team builds publication-ready forest plots, checks your heterogeneity statistics and prepares PRISMA-compliant systematic reviews.
The pooled effect and the diamond
At the foot of the chart is the diamond, the pooled effect: a weighted average of all the studies. Its centre marks the summary estimate and its width marks the summary confidence interval, so you read the diamond just as you read a study, with more data behind it1. The guiding rule of any forest plot meta-analysis is simple. If the diamond touches or crosses the line of no effect, the pooled result is not statistically significant; if it sits clear of the line, it is. In this worked example the diamond is centred at an odds ratio of 0.81, with a confidence interval of 0.73 to 0.89 that sits clear of 1.0, so the combined evidence favours the treatment3.
Judging heterogeneity (I²)
A pooled number only means something if the studies are reasonably alike. Heterogeneity describes how much the true effect varies from study to study. The most reported measure is I-squared (I²), the percentage of variation across studies that is due to real differences rather than chance2. Its authors proposed rough bands: about 25% is low, 50% moderate and 75% high2. Treat these as guides, not cut-offs, because I² is imprecise when only a few studies are pooled.
Visually, when the squares line up and the intervals overlap, heterogeneity is low; when squares scatter and whiskers barely touch, it is high. The six studies in Figure 1 give I² = 0% (Q = 3.44 on 5 degrees of freedom), so the variation is no more than chance would produce2.
A worked example table
Table 1. The data behind Figure 1: the numbers a forest plot turns into squares, whiskers and a diamond (illustrative)
| Study | Odds ratio | 95% confidence interval | Study weight (%) | Crosses line? |
|---|---|---|---|---|
| Study A (2015) | 0.82 | 0.65–1.03 | 19.6 | Yes |
| Study B (2017) | 0.75 | 0.60–0.94 | 20.6 | No |
| Study C (2018) | 0.91 | 0.70–1.18 | 15.2 | Yes |
| Study D (2019) | 0.68 | 0.52–0.89 | 14.3 | No |
| Study E (2020) | 0.88 | 0.71–1.09 | 22.5 | Yes |
| Study F (2021) | 0.79 | 0.55–1.14 | 7.8 | Yes |
| Pooled (I² = 0%) | 0.81 | 0.73–0.89 | 100 | No |
The table and the plot carry the same information in two forms. The study weight column explains why some squares are larger: Study E carries 22.5% of the weight and so pulls the pooled effect more than Study F at 7.8%. Weights here come from the inverse of each study’s variance, so the narrowest intervals earn the most weight. The “crosses line?” column mirrors what your eye does on the chart: any study whose interval spans 1.0 is individually non-significant, even when its point estimate suggests benefit4. Reading the two together is the fastest way to sanity-check a published forest plot before you trust its headline number. For effect sizes in more depth, see our forest plot interpretation guide.
Three common mistakes
Do not judge significance from the square’s position alone; check whether the interval crosses the line. Do not treat a wide diamond as a strong result, because width means uncertainty. And never accept a pooled result from studies with high heterogeneity without asking why they disagree, because a tidy diamond can hide very different effects2.
Putting the example together
This forest plot example tells a clear story. Four of six studies are individually non-significant, yet all lean towards benefit, and pooling them gives a precise, significant odds ratio of 0.81. Low heterogeneity means the studies agree. It does not prove they are unbiased, so the next step is to appraise risk of bias and publication bias. That is the whole skill of how to read a forest plot: from single rows, to the diamond, to a judgement about consistency.
Pubrica team verdict
To read a forest plot, scan each study row against the line of no effect, read the diamond as the pooled result and check heterogeneity before trusting it. The plot shows consistency and precision, not whether the studies are free of bias.
Frequently asked questions
The pooled effect is not statistically significant: the combined evidence cannot rule out no difference between the groups.
No. A bigger square means the study carries more weight, usually because it is larger or more precise, so it influences the pooled effect more. It does not mean a stronger effect.
Lower values make a single pooled estimate easier to justify. Around 25% is usually read as low and 75% or more as high, but with few studies I² is imprecise, so look at the plot as well.
Sources
Sources were checked on 27 October 2026. Requirements and guidance may change after that date; confirm the current version with the issuing body.
- 1Lewis S, Clarke M. Forest plots: trying to see the wood and the trees. BMJ. 2001;322(7300):1479–1480. https://pmc.ncbi.nlm.nih.gov/articles/PMC1120528/
- 2Higgins JPT, Thompson SG, Deeks JJ, Altman DG. Measuring inconsistency in meta-analyses. BMJ. 2003;327(7414):557–560. https://pmc.ncbi.nlm.nih.gov/articles/PMC192859/
- 3Favorito LA. Systematic review and metanalysis in urology: how to interpret the forest plot. Int Braz J Urol. 2023;49(6):775–778. https://pmc.ncbi.nlm.nih.gov/articles/PMC10947628/
- 4Lester J. The use of meta-analysis and forest plots to examine and display data in oncology research. J Adv Pract Oncol. 2014;5(6):465–470. https://pmc.ncbi.nlm.nih.gov/articles/PMC4530118/
how to read a forest plotforest plot explainedforest plot meta-analysisinterpret forest plotforest plot exampleconfidence interval
How to cite this article
Pick your referencing style and copy it. Your university or target journal may vary the punctuation, so check its guide if it has one.
Dr. Charlie. (2026, October 27). How to Read a Forest Plot: An Annotated Worked Example from a Meta-Analysis. Pubrica. https://pubrica.com/academy/meta-analysis/how-to-read-a-forest-plot/
This article is written to be learned from. Cite it if you are referring to what it says; if you are using the evidence behind it, cite the sources listed above instead.
Next steps
Need help designing, running or reporting your meta-analysis?
Pubrica’s biostatistics and medical-writing team builds publication-ready forest plots, checks your heterogeneity statistics and prepares PRISMA-compliant systematic reviews.
This article is general information for researchers, not legal, regulatory or funding advice. Check the current requirements of your journal, funder, ethics committee or regulator before you act on it.
More in Meta Analysis