Infographic Abstract Service
Pubrica designs infographic abstracts that present a study’s main finding, key number and caveat in a graphic that can be understood without the paper. The service supports authors, institutions and press offices promoting a paper on social media, in the press, on posters and in slides. A graphical abstract accompanies a paper and assumes the reader will go on to read it. An infographic must work on its own, in a social media feed and at thumbnail size, for readers who may never open the article. Pubrica’s scientific illustrators design infographics for that viewing size and that audience.
- Designed to stand alone, presenting the finding, the key number and the caveat without the paper
- Legible at thumbnail size, because most viewers see the graphic at that size first
- Data presented accurately, with axes starting at zero, proportional areas and no three-dimensional pie charts
- Delivered in every size you need: square and portrait for social media, landscape for slides and print resolution for posters
- Accessible, with contrast checked, meaning not conveyed by colour alone and alt text supplied
Concept, layout and designIncluded
Social, slide and print sizesIncluded
Alt text and contrast checkIncluded
Editable source fileIncluded
Social media posting and paid promotionYour responsibility
Paper → reduced → drawn → checked → graphic
- Stands alone without the paper
- Legible at thumbnail size
- Data presented accurately
- Sized for every channel
- Alt text supplied
Deliverables
Four Components of Every Infographic Abstract
Each infographic presents one study and one message, so its content is limited to what a viewer can understand in a few seconds.
Example from a briefSummarise the whole study in one graphic.One headline finding, one supporting number, one caveat and one line on who it applies to. Other details remain in the paper, which the graphic links to.
Example from a design reviewA bar chart with the y-axis starting at 11%.Axis starting at zero, so the four-point difference appears as four points. The difference looks smaller because it is smaller, and the accurate version withstands scrutiny when shared.
Example from a legibility checkA common problem is an attractive A3 design that becomes illegible at 400 pixels, the size at which most of its audience will see it.
Example from a deliverySupplying several sizes prevents poor cropping, and the source file allows your team to prepare later versions themselves.
The samples shown are illustrative and anonymised. Hover over a sample to replay it.
Compliance and Standards
Infographic Abstract Standards and Accessibility Guidelines
Where a journal or funder specifies a format, we follow its requirements.
Journal and press figure requirements (resolution, colour and format)
Where the graphic will be submitted to a journal or press office, we check its specified resolution, colour space and file format.
Web Content Accessibility Guidelines (level AA)
Contrast, text alternatives, captions and transcripts, which universities and funders increasingly require for any content they host.
COPE (Committee on Publication Ethics)
A derived format may not claim more than the paper supports. Overstating a finding in a graphic or a recording is a publication ethics issue.
Quality management (cert. H3CR9TCU20251212INDQM10N)
Our certified quality system governs how work is briefed, produced, reviewed and released.
Responsible Use of AI
Our Approach to AI Use in Infographic Abstracts
AI image generation presents a particular integrity risk in scientific figures. A generated cell, scan or apparatus that does not exist constitutes image fabrication, and journals now screen for it.
Why We Do Not Publish AI Accuracy Figures
Accuracy figures for AI tools are usually reported by the companies that sell them.
Pubrica therefore does not quote a self-generated accuracy figure, because it would carry the same conflict of interest. Instead, we tell you which tool was used on your project, at which stage, and what a specialist changed afterwards.
Our Process
How Our Infographic Abstract Process Works
We agree the content before design begins, because selecting what to include is the most important part of the work.
Paper Review and Content Selection
We read the full paper and agree the single message, supporting number and necessary caveat with you before design begins.
Concept and Layout
We sketch the structure and reading path, showing where the viewer looks first and next, for your approval before final design.
Design and Data Accuracy Check
After design, we check that axes start at zero, areas are proportional, contrast meets WCAG 2.2 AA and no claim goes beyond what the paper supports.
Sizes and Handover
We export square, portrait, landscape and print-resolution versions, with alt text and the editable source file.
Sample Work
Sample Infographic Abstracts
An infographic presents a broader explanation than a graphical abstract, mainly in text and arranged around a key takeaway.
Shown in full with the client’s permission.
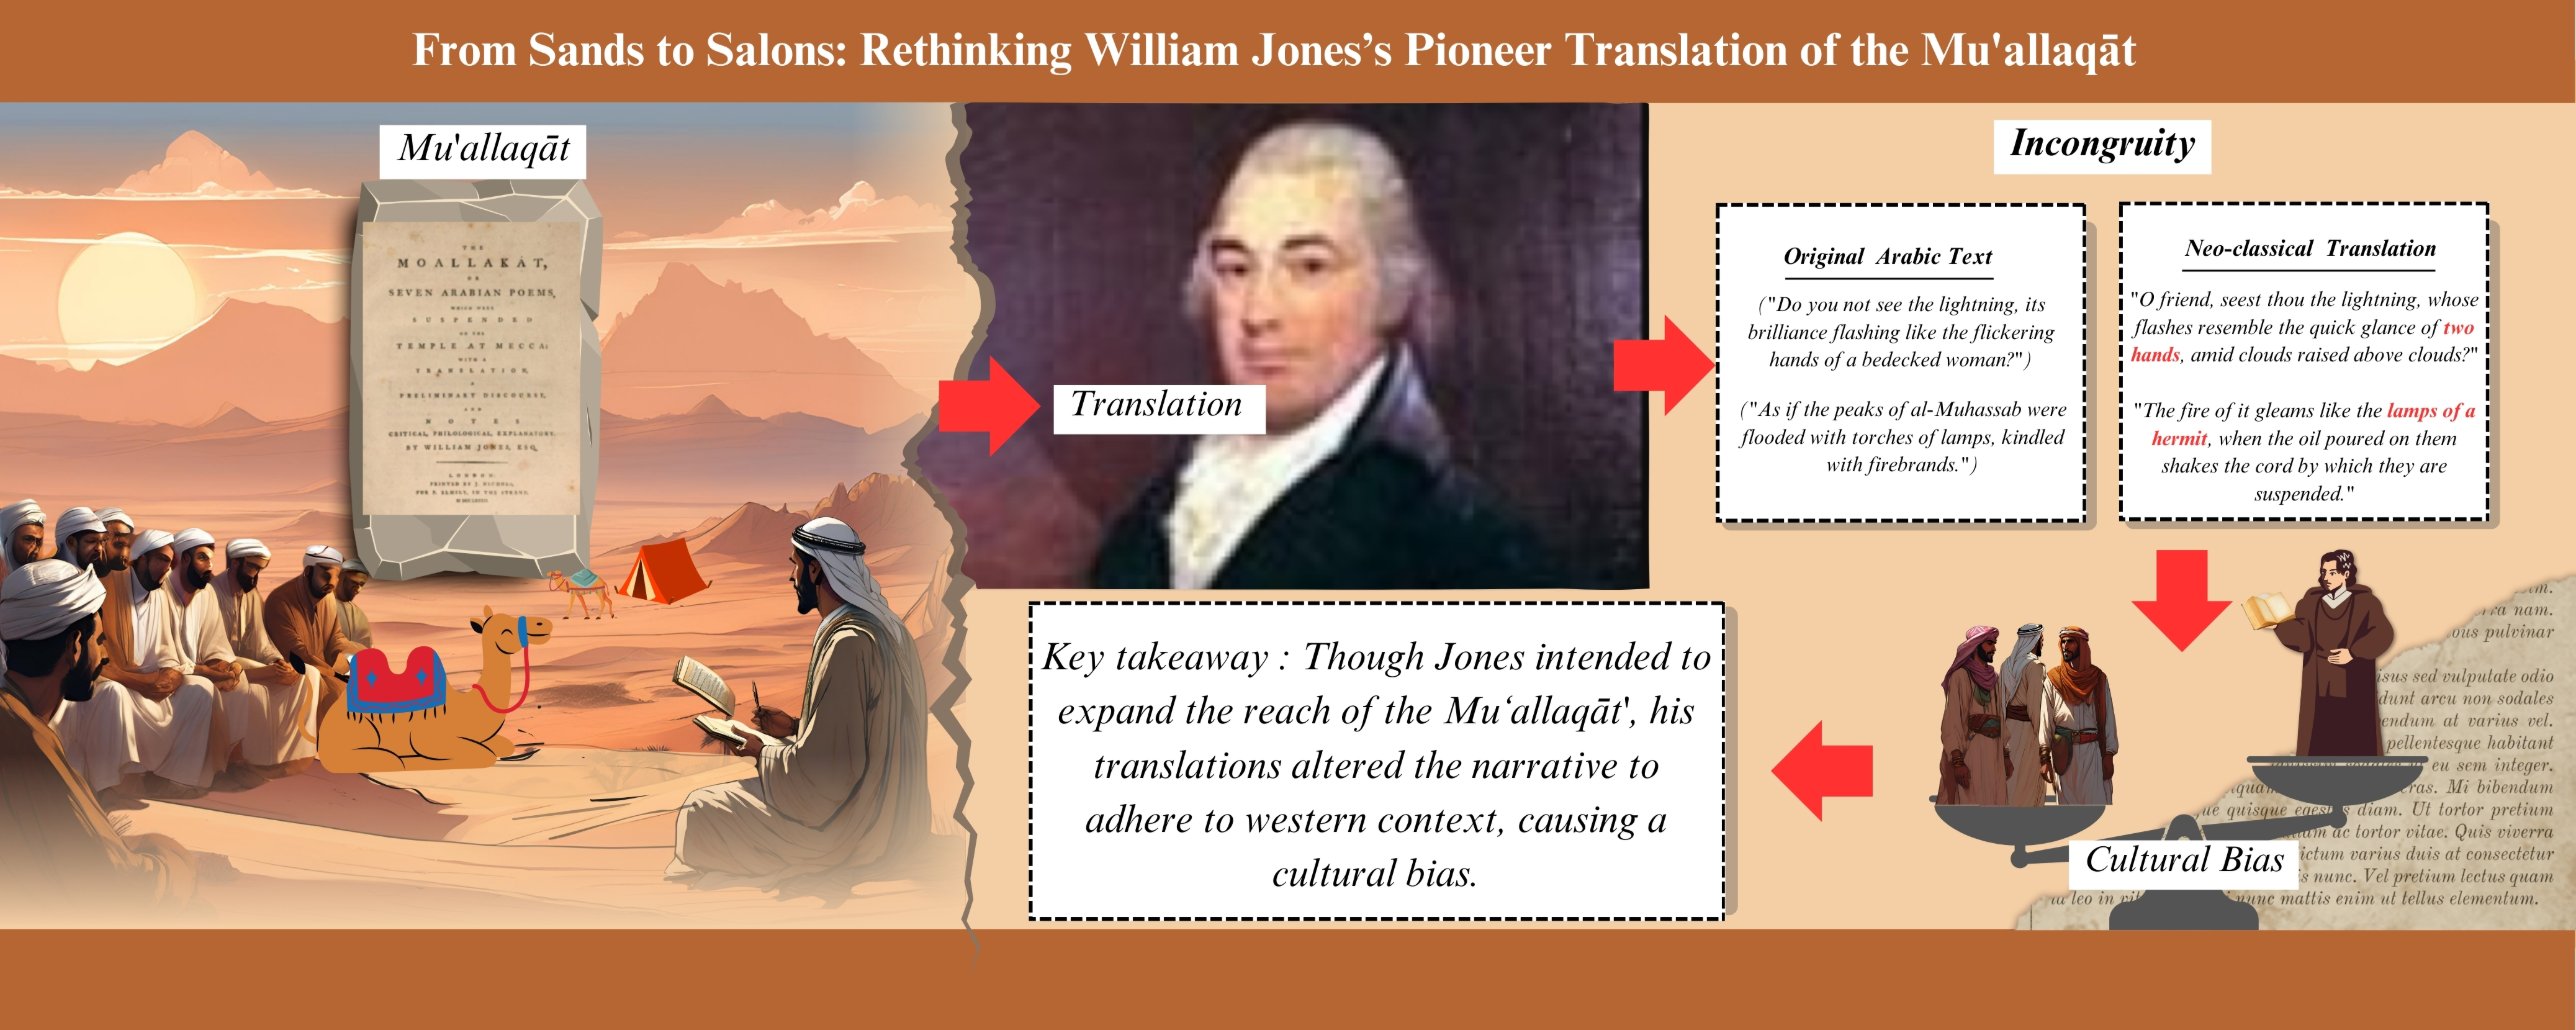
Humanities · translation studies
Shown with permission. Client-commissioned infographic for a study of William Jones’s translation of the Mu’allaqāt.
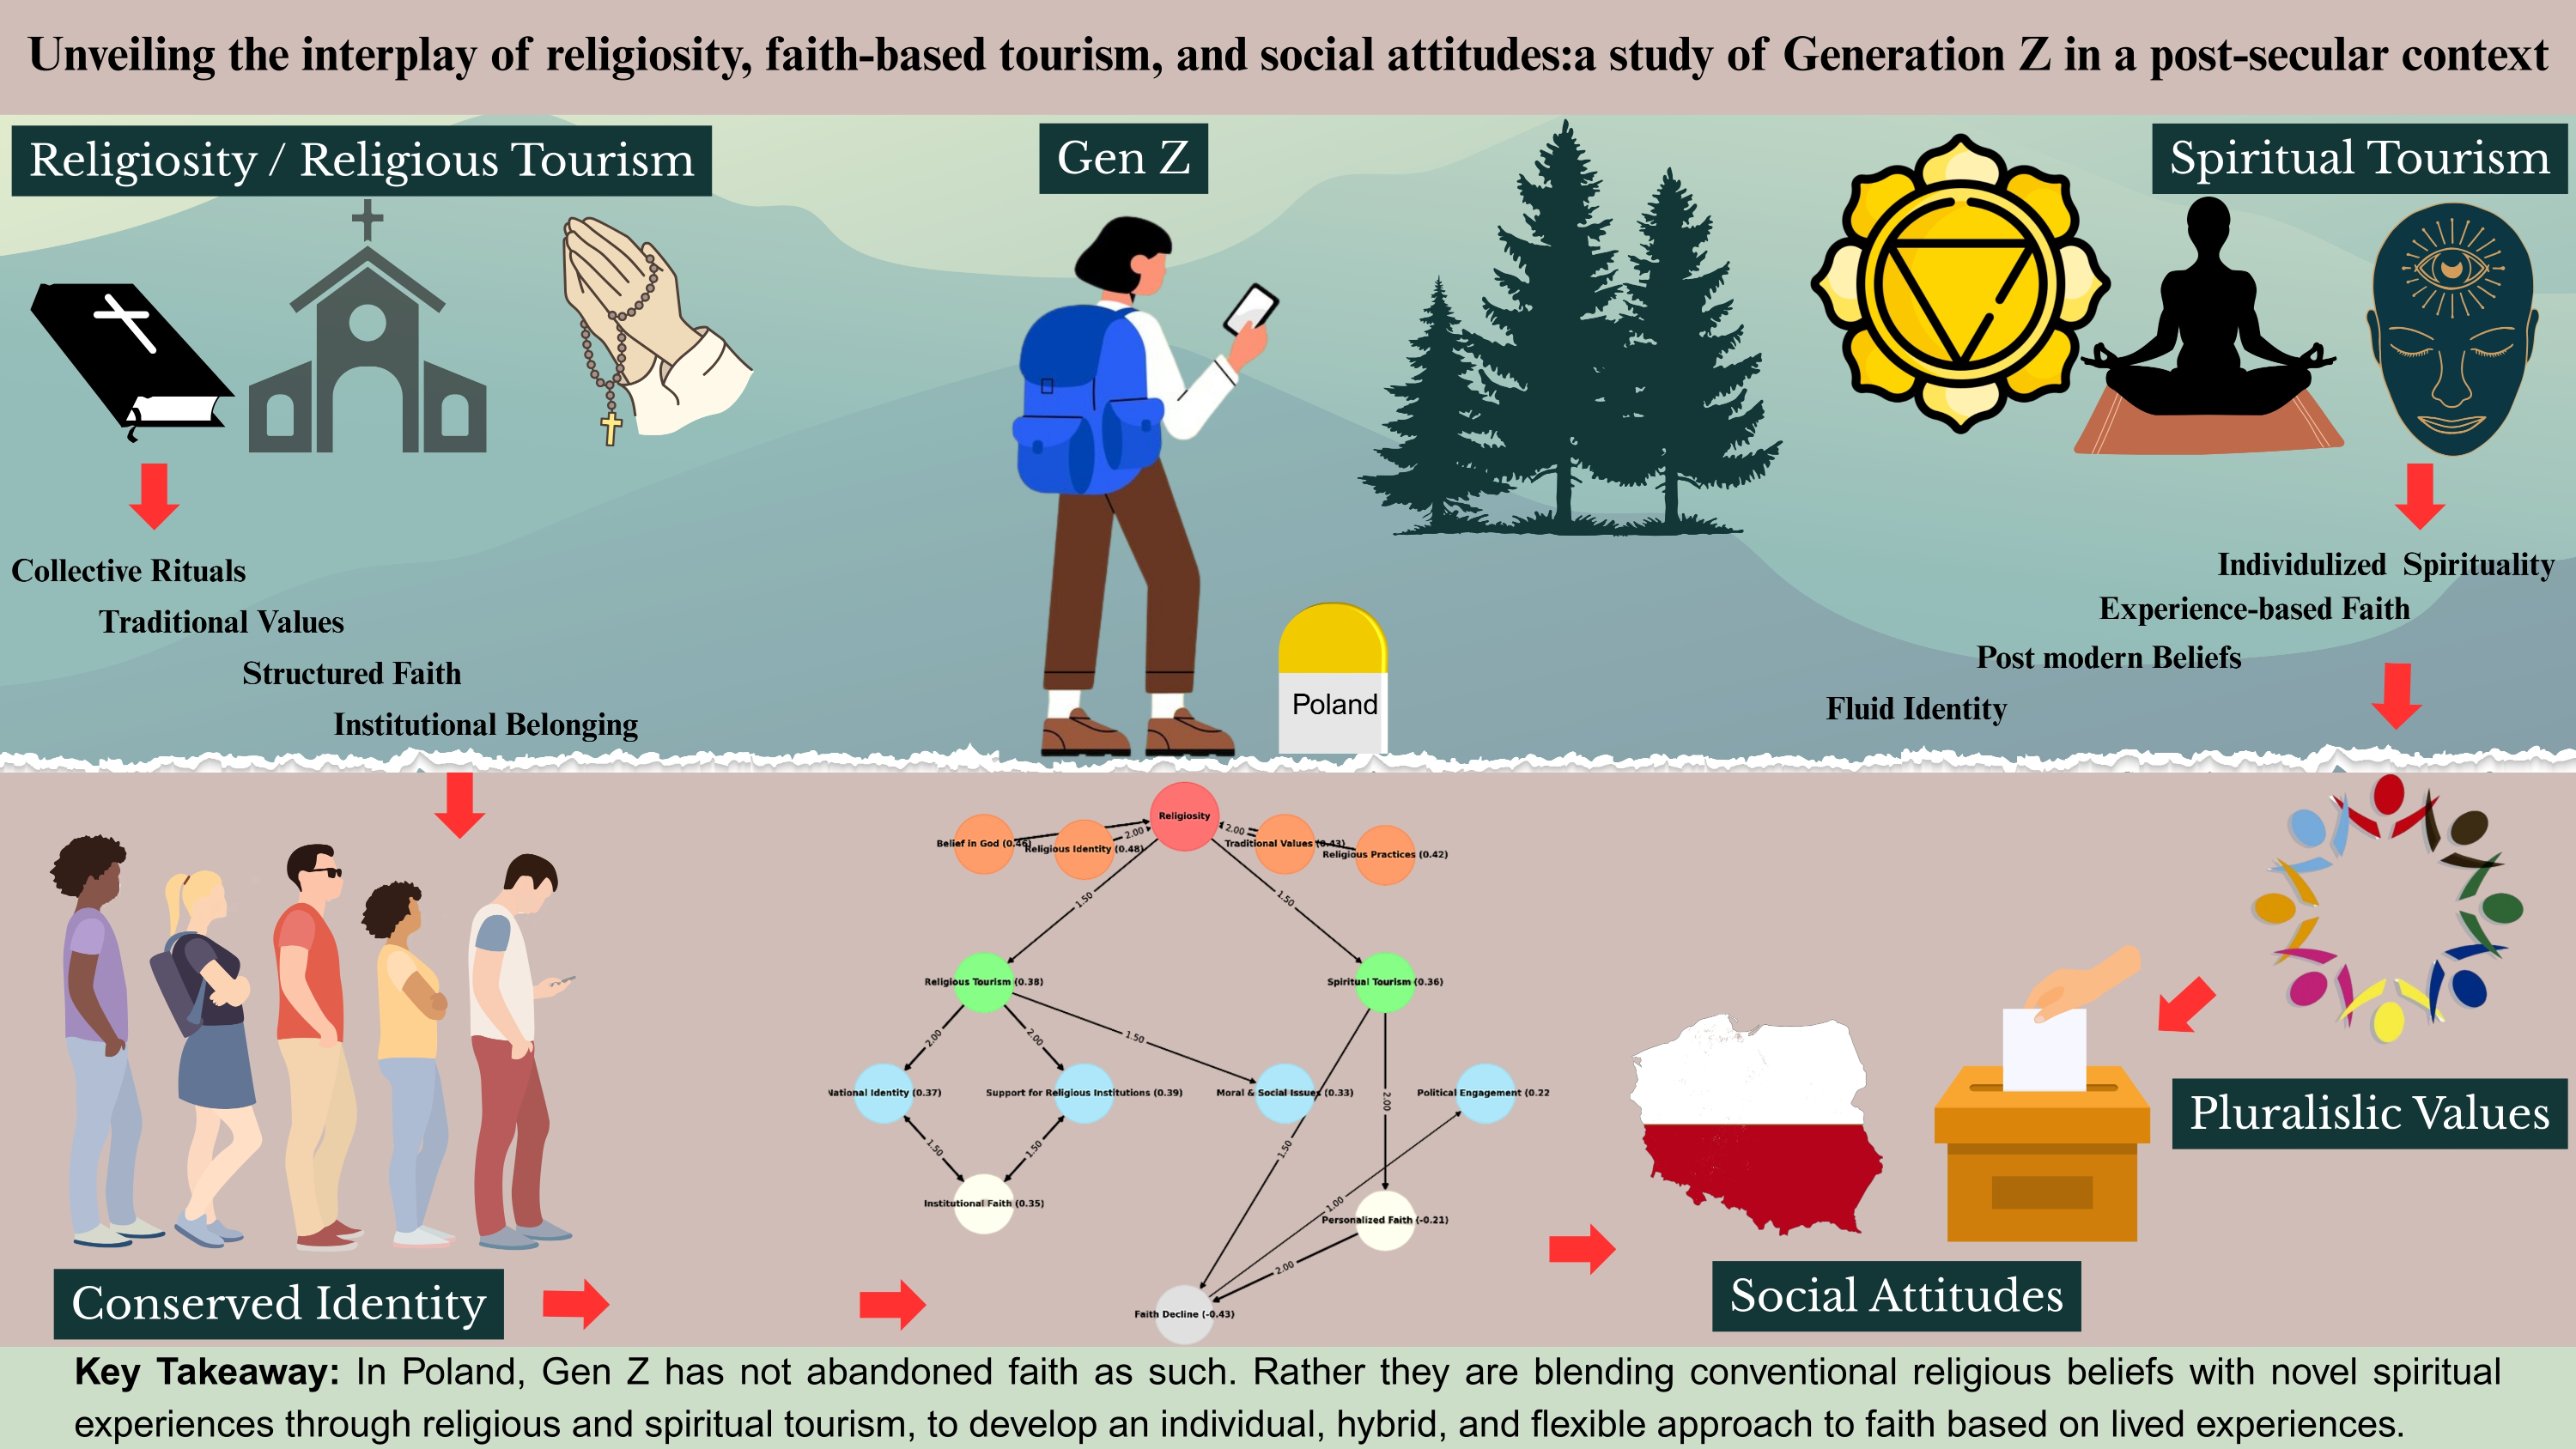
Social science · cohort survey study
Shown with permission. Client-commissioned infographic for a study of religiosity and tourism among Generation Z in Poland.
Our Experts
Your Infographic Abstract Team
A named team of subject specialists stays with your project from scoping to delivery. Your project coordinator introduces each team member by name before work begins.
Reviews the scientific content for accuracy and confirms that each conclusion is supported by the evidence. Each expert is matched to your field of research.
Designs figures, posters, abstracts and media that represent the data accurately and meet the specifications of the target journal or platform.
Checks the finished work independently against the agreed scope and the applicable checklist. Findings are logged and resolved before delivery.
Manages the timeline, keeps you informed at each stage and coordinates the team so that questions are answered and deadlines are met.
Packages
Infographic Abstract Packages
Prices depend on complexity and on the number of size variants and adaptations you need.
Infographic abstract
For authors, institutions and press offices promoting a paper
Quoted per projectAccording to complexity and variants
Delivery Quoted by scope
- ✓One message agreed before design
- ✓Concept and layout approved before final design
- ✓Social, slide and print sizes
- ✓Alt text and contrast check
- ✓Editable source file
- ✓Two revision rounds
If the infographic will go to a journal or press office, please tell us, because their format requirements are specific.
Deliverables Request a quoteCampaign set
For a paper promoted across several channels, or a series of papers
Quoted per projectAccording to number of assets
Delivery Quoted by scope
- ✓A primary infographic plus derived assets
- ✓Consistent visual style across the set
- ✓Sizes for every channel you specify
- ✓Alt text for each asset
- ✓Source files your team can adapt
Once a visual style has been established, infographics for later papers cost less.
Deliverables Request a quoteSend us your paper, and we will recommend the single message it should present, free of charge.
FAQs
Frequently Asked Questions About Infographic Abstracts
If your question is not answered here, please ask an expert. No quote is required.
A graphical abstract appears at the top of the article and assumes the reader will go on to read the paper, so it can use the paper’s terminology.
An infographic must work on its own, in a feed and at thumbnail size, for readers who may never open the article, so it includes the caveat as well as the finding.
It can, but we usually advise against it. A graphic with four findings tends to communicate none of them clearly, because viewers cannot tell which matters most.
If a paper has two headline findings, a set of two graphics works better than one crowded graphic.
A truncated axis makes a small difference appear large, and an infographic is designed to be shared without the paper.
A graphic that overstates a finding is a publication ethics issue, however well designed, and is likely to be criticised when shared.
Square, portrait and landscape exports, a print-resolution version, alt text and the editable source file.
The source file allows your team to prepare later versions, such as a conference adaptation, without returning to us.
Related Services
Related Research Impact Services
Other formats for presenting the same paper in different settings.
1OTHER VISUAL FORMATSoften commissioned together
Graphical abstractFor the top of the article. Artwork preparationThe paper’s own figures, prepared to the journal’s specification.2FOR PRESENTATIONSslides and posters
Slide deck and slide abstractDesigned for presentation to an audience. Poster preparationThe conference poster version.3FOR MEDIA COVERAGEwritten formats
Scientific news reportA media-ready press release, from $149. Simplified abstractFrom $200, structured to the journal’s format.Request a Free Key Message Assessment for Your Infographic
We will recommend the single message your infographic should present, free of charge, because a graphic with several findings communicates none of them clearly.