Scientific Illustration
Pubrica provides original scientific illustration for researchers, PhD scholars, research institutions, medical writers and life-science teams. Our illustrators read your paper and data, then draw mechanism diagrams, anatomical and molecular figures, pathways and device illustrations to your target journal’s specification, delivered with editable vector source files. Artwork preparation reformats a figure you already have; illustration creates a figure that does not yet exist, drawn by Pubrica’s own illustrators from your figures and data rather than from a stock library.
- Drawn from your description and your data, not traced from existing images, so the figure is original work that you own
- Drawn by illustrators who read the science, because a mechanism diagram drawn from a caption alone can misrepresent causality in ways that are only noticed at peer review
- Supplied as editable vector files, so a reviewer’s request to relabel one arrow is a quick edit rather than a redraw
- Prepared to the journal’s specification, including colour space, resolution, font embedding, line weights and panel lettering
- Accurate to the data, with what you demonstrated and what you inferred kept visually distinct in the drawing
Original figures drawn from scratchIncluded
Editable vector source handed overIncluded
Journal specification appliedIncluded
Revision roundsIncluded
Reformatting existing figuresCovered by artwork preparation
Science → sketched → reviewed → drawn → figure
- Drawn from your science, not traced from other images
- Sketch approved before final artwork
- Editable vector files supplied
- Prepared to the journal’s specification
- Inference kept visually distinct from data
Deliverables
What Every Scientific Illustration Includes
Each figure is designed to communicate one main point, and the drawing implies no more than the data support.
Example from the processApproving a rough sketch prevents most costly revisions, because expensive changes usually arise from a concept that was not checked early.
Example from a reviewArrow drawn from the receptor to the ligand.Binding direction corrected, the missing feedback loop added, and the two simultaneous steps drawn as simultaneous rather than sequential.
Example from a figureA diagram that presents hypothesis and finding in the same way is misleading, and reviewers increasingly point this out.
Example from a deliveryWith flat 300 dpi images, every later change requires a redraw, which adds cost to the project.
The samples shown are illustrative and anonymised. Hover over a sample to replay it.
Compliance and Standards
Scientific Illustration Standards and Journal Figure Requirements
Where the journal specifies figure requirements, we follow those requirements.
Journal figure specification (resolution, colour, fonts, line weights)
Minimum resolution, colour space, embedded fonts, minimum line weight and panel lettering conventions, specified at the brief and checked before delivery.
COPE (Committee on Publication Ethics)
An illustration may not claim more than the paper supports or misrepresent what was observed.
Web Content Accessibility Guidelines (level AA)
Contrast, text alternatives and captions, which institutions and funders that host research assets increasingly require.
Quality management (cert. H3CR9TCU20251212INDQM10N)
Our certified quality system governs how work is briefed, produced, reviewed and released.
Responsible Use of AI
Our Approach to AI Use in Scientific Illustration
AI image generation presents a particular integrity risk in scientific figures. A generated cell, scan or apparatus that never existed is image fabrication, and journals now screen for it.
Why We Do Not Publish AI Accuracy Figures
Accuracy figures for AI tools are usually reported by the companies that sell them.
Pubrica therefore does not quote a self-generated accuracy figure, because it would carry the same conflict of interest. Instead, we tell you which tool was used on your project, at which stage, and what a human reviewer changed afterwards.
Our Process
How Our Scientific Illustration Process Works
Most of the cost of an illustration is determined at the brief and sketch stages; rendering follows a predictable schedule once the sketch is approved.
Brief and References
We confirm what the figure must show, the data or description behind it, any reference images and the target journal.
Sketch
Composition, reading order and labelling are prepared as a rough sketch and sent for your approval before final artwork begins.
Illustration
The figure is drawn as editable vector artwork, with inferred steps kept visually distinct from demonstrated findings.
Journal Specification and Handover
We apply the journal’s requirements, produce the export files and supply the editable source files with the figure.
Sample Work
Sample Explanatory Scientific Figures
Diagrams that help readers follow a method or dataset, such as a sampling procedure, a mechanism or a data structure, drawn for the specific manuscript rather than adapted from a template.
Shown in full with the client’s permission.
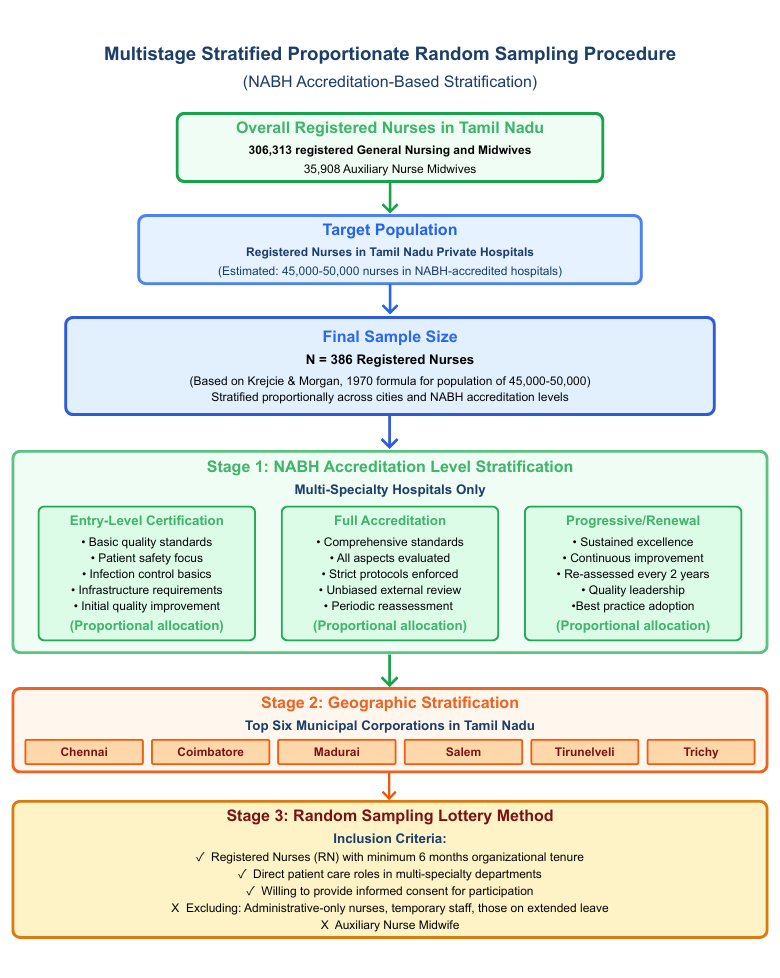
Methods figure · nursing & health services research
Shown with permission. Client-commissioned methods diagram for a multistage stratified sampling study.
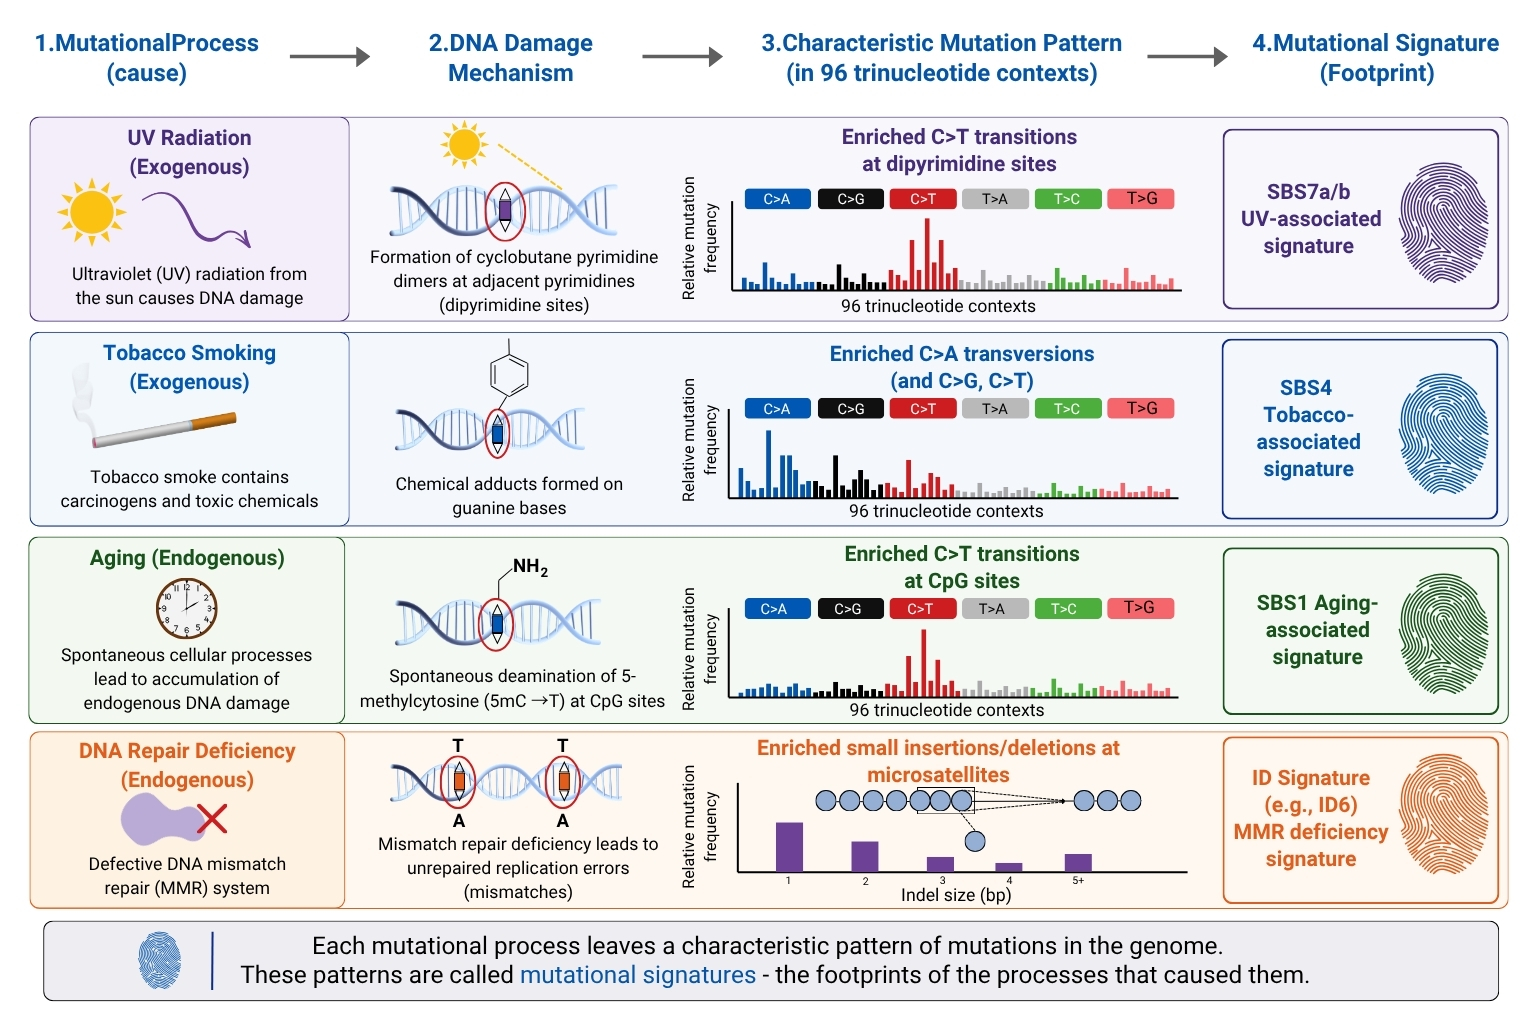
Mechanism figure · cancer genomics
Shown with permission. Client-commissioned mechanism diagram for a mutational-signatures study.
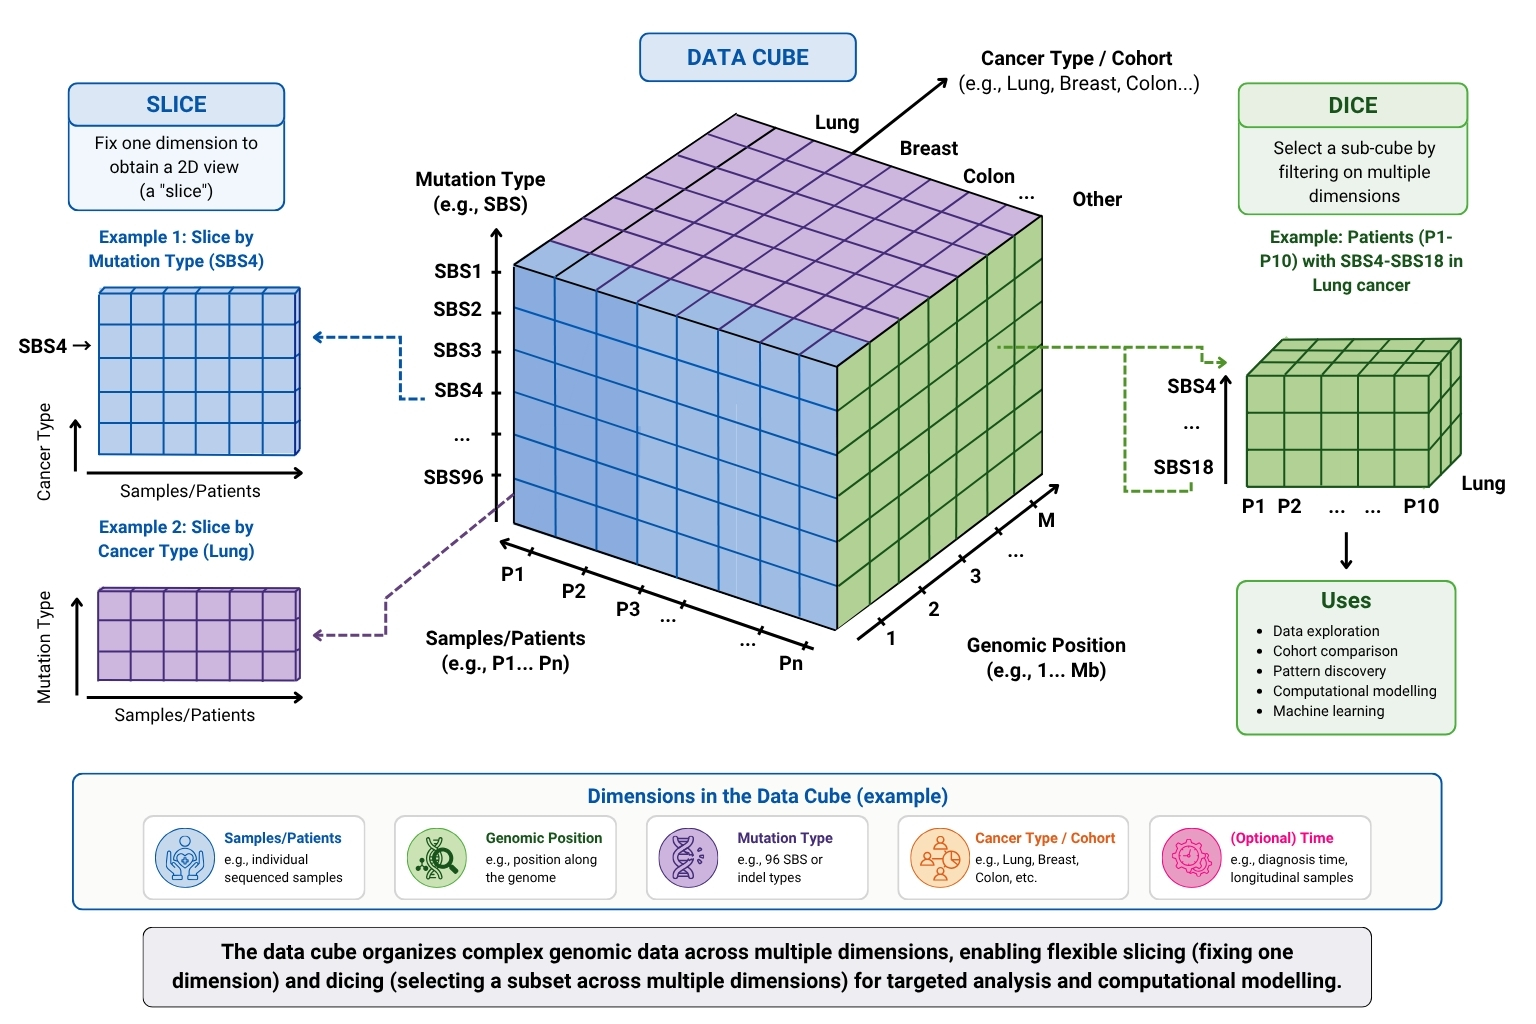
Concept figure · computational genomics
Shown with permission. Client-commissioned concept diagram for a genomic-data-structure methods paper.
Our Experts
Your Scientific Illustration Team
A named team of subject specialists and illustrators stays with your project from scoping to delivery, and your project coordinator introduces them before work begins.
Reviews the scientific content for accuracy and confirms that each conclusion is supported by the evidence. Matched to your field rather than allocated from a rota.
Draws figures and illustrations that represent the data accurately and meet the specifications of the target journal or platform.
Checks the finished work independently against the agreed scope and the applicable checklist. Findings are logged and resolved before delivery.
Manages the timeline, keeps you informed at each stage and coordinates the team so that questions are answered and deadlines are met.
Packages
Scientific Illustration Packages
Prices depend on figure complexity, panel count and how much of the content must be developed from the paper rather than drawn from an existing sketch.
Single figure
One original illustration for a paper, grant or presentation
Quoted per projectBased on complexity and panel count
Delivery Quoted by scope
- ✓Brief and reference review
- ✓Sketch approved before final artwork
- ✓Drawn as editable vector artwork
- ✓Journal specification applied
- ✓Two revision rounds
- ✓Source files supplied
Please send the full paper as well as the figure legend, because our illustrators work from the science.
Deliverables Request a quoteFigure set or visual style
For a paper, thesis or programme that needs several figures
Quoted per projectBased on figure count and style complexity
Delivery Quoted by scope
- ✓A consistent visual system across the set
- ✓Consistent colours, line weights and labelling
- ✓Shared component library for reuse
- ✓Sketch and approval for each figure
- ✓Source files your team can adapt
Once a visual style is established, later figures cost considerably less than the first.
Deliverables Request a quoteSend us a description of the figure you need, and we will prepare a free concept sketch. The sketch stage is where the design of the figure is decided.
FAQs
Frequently Asked Questions About Scientific Illustration
If your question is not answered here, please ask an expert. No quote is required.
Artwork preparation takes a figure you already have and makes it meet a journal’s specification for resolution, colour space, fonts and panel lettering.
Illustration creates a new figure. If you have no existing figure to reformat, this is the service you need, and it involves considerably more work.
Yes. A rough sketch together with the paper is the ideal brief. We need the science and your intended message, and our illustrators prepare the drawing.
Without the paper, an illustrator works only from the caption, which is how mechanism diagrams come to show the wrong causal direction.
You do. The illustration is original work made for you, delivered with the editable source files, and the rights are assigned to you.
This allows you to reuse the same figure in a thesis, a presentation and a later review without a new licence.
Yes. Where a paper already has figures, we draw the new illustration in the same visual style so that the set is consistent.
For a figure set, we establish the visual system first so that every later figure is consistent with it.
Related Services
Related Research Impact Services
Services for the figures in your paper and the assets derived from it.
1IF YOU ALREADY HAVE THE FIGUREartwork and data figures
Artwork preparationExisting figures reformatted to journal specification. Interpretation and visualisationFigures prepared from your data.2ASSETS DERIVED FROM YOUR PAPERin the same visual style
Graphical abstract$150 for 2D and $250 for 3D. Journal cover artArtwork for a journal cover invitation or submission.Request a Free Scientific Illustration Concept Sketch
The free concept sketch is the stage at which the design of the figure is decided.