
- Services
- Discovery & Intelligence Services
- Publication Support Services
- Sample Work

Publication Support Service
- Editing & Translation
-
Editing and Translation Services
- Sample Work

Editing and Translation Service
-
- Research Services
- Sample Work
Research Services
- Physician Writing
- Sample Work

Physician Writing Service
- Statistical Analyses
- Sample Work
Statistical Analyses
- Data Collection
- AI and ML Services
- Sample Work

AI and ML Services
- Medical Writing
- Sample Work
Medical Writing
- Research Impact
- Sample Work

Research Impact
- Medical & Scientific Communication
- Sample Work

Medical & Scientific Communication
- Medico Legal Services
- Educational Content
- Academic Editorial Services
- Sample Work
Academic Editorial Services
- Educational Editorial Service
-
Education Editorial Services
- Sample Work
Education Editorial Services
-
- Industries
- Subjects
- About Us
- Academy
- Insights
- Contact Us
Forest Plots, Effect Sizes, and Data Interpretation in Research
- Home
- Academy
- Meta Analysis
- Forest Plots, Effect Sizes, and Data Interpretation in Research
High-Impact Journals
Interesting topics
Forest Plots, Effect Sizes, and Data Interpretation in Research
Forest plots are visual tools for meta-analysis, displaying individual study effect sizes (as squares), their 95% confidence intervals (horizontal lines), and a combined total effect (diamond) to show research trends. They highlight study weights, heterogeneity, and statistical significance relative to a “line of no effect”
Forest plots and effect sizes play a central role in modern evidence synthesis and are widely used to summarize findings across multiple studies. In quantitative research synthesis and interpretation, forest plots and effect sizes are essential tools. While a lot of researchers see forest plots when they conduct meta-analyses, it’s very important to understand what they mean and how to interpret them so that the researcher can draw valid conclusions about their research. This article explains the concepts of forest plots and effect sizes and provides practical guidance grounded in methodological research.
1. What Are Forest Plots?
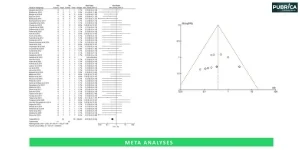
Forest plots provide a graphic representation of the estimated effect size from multiple studies, and normally they appear in systematic reviews or meta-analyses. A standard forest plot will include:
- Estimates of effect size of each individual study.
- Confidence intervals for each of the effect sizes mentioned above.
- A combined estimate of effect size providing the researcher with one overall effect size for their research.
A Meta-analysis forest plot visually organizes these elements to help readers quickly compare individual and pooled study outcomes.
INSIGHT: Why use Forest Plots?
Forest plots provide a means of visually communicating variances and consistencies across multiple studies/analyses. It enables the individual and aggregated results of individual studies to be displayed visually. [1]
Forest Plot Benefits
- Shows study weights visually
- Identifies heterogeneity
- Enhances transparency in meta-analysis
2. Understanding Effect Sizes
Effect sizes are quantitative measurements of the degree to which a certain event exists. Where p-values indicate the level of significance of a result (i.e., statistical significance), effect sizes provide information about the actual size of the effect.[2] Understanding Effect size vs p value is essential because statistical significance does not always reflect practical importance.
Common Effect Size Metrics
Measure | Use Case |
Cohen’s d | Standardised mean differences |
Odds Ratio (OR) | Binary outcomes |
Correlation (r) | Strength of relationships |
Hedges’ g | Small sample adjustment |
Effect sizes facilitate comparison across different scales and designs.[2]
3. Anatomy of a Forest Plot
A forest plot is an illustration that summarizes how effects across several different empirical datasets or studies have been combined into an average effect size. By looking at the plot, one can identify quickly the magnitude, direction, and precision of each individual study as well as the overall average effect size from all studies included in that meta-analysis. Forest plot in meta-analysis serves as a structured visual framework for interpreting pooled quantitative evidence.
Key Components of a Forest Plot
- Study Names – The individual studies represented in the analysis, and therefore contributing to the overall estimate, are typically represented in the rows of a forest plot.
- Effect Size (ES) – The quantitative estimation of the effect associated with the study, with the most common types of ES being Cohen’s d, odds ratio, correlation, etc., dependent on the type of outcome being studied.
- Confidence Intervals (CI) – Horizontal lines extending from each Point Estimate show the 95% Confidence Interval. The CI shows the range which the true value of the effect is expected to lie. The narrower the interval, the more precise the average effect size; conversely, the more extensive the interval, the greater the uncertainty in the average estimated effect size.
- Pooled Effect The combined averaged effects of all of the individual studies included in the forest plot are typically displayed at the bottom of the plot; the pooled effect is frequently depicted as a diamond shape. The pooled effect displays the average effect of all of the individual studies included in the forest plot and is a quick and easy visual reference for assessing the overall trend.
CONCEPTUAL EXAMPLE
Study | Effect Size (ES) | 95% CI |
Study A | 0.28 | 0.10 – 0.45 |
Study B | –0.05 | –0.20 – 0.10 |
Study C | 0.42 | 0.30 – 0.65 |
Overall | 0.25 | 0.15 – 0.40 |
Interpretation:
- Study A and Study C show positive effects with confidence intervals not crossing zero, suggesting meaningful improvements.
- Study B shows a negligible effect with CI crossing zero, indicating uncertainty about the direction of effect.
- The pooled effect (0.25) indicates a small but positive overall effect across all studies.
Reading Forest Plots Effectively
- Check the CI: Non-overlapping CIs suggest stronger evidence of effect, but statistical significance is determined by pooled tests.
- Look for heterogeneity: Large differences in CI widths or effect directions may indicate study variability.
- Consider study weight: Some plots vary the size of the marker (square) to reflect each study’s contribution.
4. Interpreting Effect Sizes in Context
Effect sizes must always be interpreted within a wider context; the following factors affect interpretation of an effect size:
- The norms of the relevant research area – a small effect may be significant in education but might be trivial in physics
- The importance of the outcome – saving lives can come from small effects in health
- The characteristics of the sample – the variability of the sample will affect the precision of estimating the effect size
Careful Statistical data interpretation ensures that effect sizes are evaluated within their methodological and practical framework.
This structured search approach is a core component of Systematic Literature Review Methodology used in evidence synthesis.
5. Heterogeneity and Forest Plots
Variability in treatment effects is called “heterogeneity. The variability of effect size can be visualised using forest plots. The degree of heterogeneity can be assessed using the following:
- I² statistic – is a measure of how much of the measured variability is due to true variation in the data
- Cochran’s Q is used to test for heterogeneity.
High heterogeneity weakens the confidence in pooled estimates and may indicate fundamental differences in populations or methodologies. [3]
6. Common Errors in Interpretation
Researchers often misinterpret forest plots by:
- Ignoring confidence intervals (CIs)
- Assuming that statistical significance is guaranteed with nonoverlapping confidence intervals (CIs)
- Not considering study quality and/or bias[4,5]
Meta-analysis graph interpretation requires attention not only to visual elements but also to study design and methodological rigor.
7. Integrating Forest Plots into Research Practice
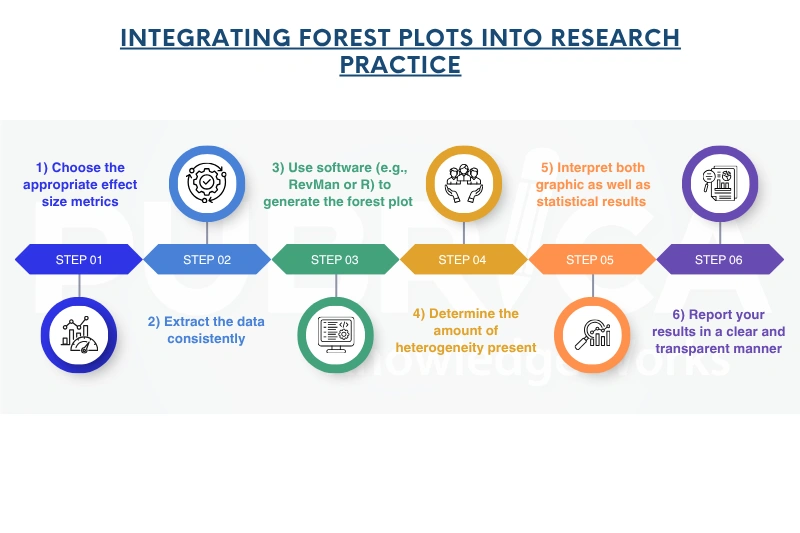
In addition, researchers should contextualize their findings by comparing to the relevant theories and previous empirical evidence.
Connect with us to explore how we can support you in maintaining academic integrity and enhancing the visibility of your research across the world!
Conclusion
Quantitative research synthesis uses forest plots and effect sizes as valuable instruments. Forest plots and effect sizes provide a comprehensive visual and statistical representation of the strength and consistency of the available evidence when used correctly. In order to make meaningful use of forest plots, researchers have to not only know how to produce them but also interpret them carefully while considering the relevant context, the heterogeneity of the studies involved, and their practical significance.
Partner with Pubrica’s expert biostatisticians and research methodologists to ensure your systematic review is methodologically rigorous, publication-ready, and aligned with international reporting standards.[Get Expert Publishing Support] or [Schedule a Free consultation}
References
- Lester, J. (2014). The use of meta-analysis and forest plots to examine and display data in oncology research. Journal of the Advanced Practitioner in Oncology, 5(6), 465–470. https://doi.org/10.6004/jadpro.2014
- Borenstein, M., Hedges, L. V., Higgins, J., & Rothstein, H. R. (2021). Introduction to meta-analysis(2nd ed.). John Wiley & Sons. https://www.agropustaka.id/wp-content/uploads/2020/04/agropust
- Thompson, S. G., & Higgins, J. P. (2002). How should meta-regression analyses be undertaken and interpreted?. Statistics in medicine, 21(11), 1559–1573. https://doi.org/10.1002/sim.1187
- Cumming, G., & Finch, S. (2005). Inference by eye: confidence intervals and how to read pictures of data. The American psychologist, 60(2), 170–180. https://doi.org/10.1037/0003-066X.60.2.170
- Knol, M. J., Pestman, W. R., & Grobbee, D. E. (2011). The (mis)use of overlap of confidence intervals to assess effect modification. European journal of epidemiology, 26(4), 253–254. https://doi.org/10.1007/s10654-011-9563-8