TLFs in Clinical Trials: How Tables, Listings and Figures Map to Your SAP
A table can look right and still report the wrong population or contrast. A five-stage evidence test links each output to the SAP, the analysis data, the program and its verification.

- TLF
- Tables, listings and figures
- Traceability chain
- SAP → ADaM → specification → output
- Review framework
- Five stages, definition to release
- Most dangerous error
- A plausible table on the wrong population
Quick answer
- Every output should trace to an SAP section, an ADaM dataset, a specification and a program version.
- Verify the method and inputs, not only the displayed numbers.
- Record each discrepancy, its fix and the recheck.
01What are tables, listings and figures in clinical trials?
A clinical trials TLF can look correct yet report the wrong population, denominator or treatment contrast. Tables, listings and figures (TLFs) are the outputs of the statistical analysis:
- Tables summarise demographics, efficacy results, laboratory values and treatment-emergent adverse events.
- Listings show participant- or record-level detail, such as each adverse event’s term, onset, severity and relationship to treatment.
- Figures present Kaplan–Meier curves, mean change over time and forest plots.
These outputs often share populations, endpoint definitions and derivations, so their relationship must stay traceable when they represent the same planned analysis.
02How SAP-to-TLF traceability works
The statistical analysis plan defines the planned analyses: endpoints, populations, methods, treatment comparisons and missing-data approaches. ADaM datasets supply the records and variables to implement them, TLF specifications define output-specific programming rules, and shells set out the intended presentation (Figure 1).
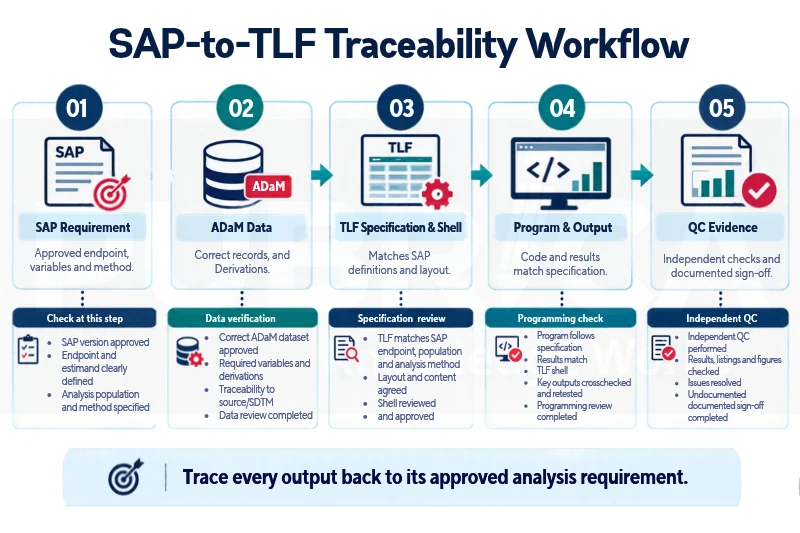
CDISC describes ADaM as supporting “traceability among analysis results, analysis data, and data represented in the Study Data Tabulation Model”, and its traceability examples show how a reviewer can follow a result back to source data [1, 2]. SAP-to-TLF traceability applies the same idea to each output.
03A five-stage TLF evidence test
Table 1 is a practical review framework we propose, not a regulatory standard. It turns the traceability chain into a repeatable review, and reviewers can step back to an earlier stage whenever a discrepancy points to the definition, dataset or program rather than the presentation.
| Stage | Review question | Evidence to examine |
|---|---|---|
| 1. Definition | What analysis was approved? | SAP section, endpoint, population, model and treatment contrast |
| 2. Data | Which records and derivations support the result? | ADaM dataset, variables, selection rules and population flags |
| 3. Implementation | Was the analysis programmed as specified? | TLF specification, shell, program and versions |
| 4. Verification | What shows the result is correct? | Recalculations, statistical checks, reconciliations and discrepancy records |
| 5. Release | Does the final output reflect approved requirements and completed checks? | Final output, labels, footnotes, review status and change history |
Consider a hypothetical trial comparing Treatment A with Treatment B on change from baseline at Week 12, reporting an adjusted difference, 95% confidence interval and p-value. A traceability record should name the requirement and the evidence that it was met (Table 2), and link to the controlled files rather than just list their names.
| Traceability field | Illustrative record |
|---|---|
| Output ID | T-14 |
| SAP reference | Section 9.3, primary efficacy analysis |
| Endpoint | Change from baseline at Week 12 |
| Analysis population | Full analysis set, as defined in the SAP |
| Dataset and variables | ADSL for subject-level information; the relevant BDS records and endpoint variables |
| Specification / shell / program | T-14 specification v1.2; shell v1.1; T14.sas v1.3 |
| QC status | Pending until required checks are completed and reviewed |
| Discrepancy resolution | Finding, decision, affected versions, corrective action and recheck status |
04How to verify the reported statistical result
Suppose the output reports an adjusted mean difference of −2.4 units (95% CI −4.1 to −0.7; p = 0.006). These values are illustrative. The reviewer should:
- Confirm the model, population, treatment coding and contrast against the SAP.
- Verify the records and derived variables supplied to the model.
- Reproduce or independently verify the estimate and standard error.
- Check the confidence interval, including degrees of freedom and critical value.
- Check that the p-value matches the test statistic and is consistent with the interval.
- Record the evidence and resolve discrepancies before release.
Here the interval is symmetric around −2.4 (half-width 1.7), implying a standard error of about 0.87 and z ≈ 2.8, which is consistent with p ≈ 0.006. A matching estimate alone is not enough if the wrong population or contrast was used.
05What belongs in the SAP, TLF specification and shell
The three documents have related but distinct responsibilities (Table 3). If the SAP specifies change from baseline but the shell labels the result as the observed Week 12 value, the programmer should not silently pick one. The responsible statistician resolves it through change control, and the affected specifications, programs and outputs are updated and rechecked.
| Document | Primary responsibility | Example |
|---|---|---|
| SAP | Defines the planned analysis | Endpoint, population, model, contrast and missing-data approach |
| TLF specification | Defines output-specific implementation rules | Record selection, source variables, summaries and statistics |
| TLF shell | Defines the intended output structure | Treatment columns, estimate, confidence interval, p-value and footnotes |
06How SDTM and ADaM support TLF generation
SDTM standardises how clinical study data are tabulated; ADaM provides analysis-ready datasets and traceability back to SDTM [1, 3]. For a Week 12 endpoint, the analysis dataset may hold baseline and post-baseline records, change-from-baseline variables, treatment and population flags. Demographic tables, adverse event summaries and survival analyses usually draw on other datasets, so establish which dataset supports each output. Our SDTM vs ADaM guide works through a derivation. For regulatory submissions, follow the applicable study-data standards, such as the FDA Study Data Technical Conformance Guide [5]; these need not apply to every internal reporting package.
07Clinical trial TLF QC: common programming errors
Reporting procedures automate layout, but no software can resolve an ambiguous endpoint or conflicting definitions. Clinical trial TLF QC should test statistical correctness, alignment with the specification and presentation (Table 4). ICH E6(R3) expects changes to source records to be traceable and quality control to be applied with a risk-based approach at each stage of data handling [4]. Independent programming, where required, gives a different check from reviewing the original code.
| TLF programming error | Investigation | Evidence of resolution |
|---|---|---|
| Incorrect analysis population | Compare selection criteria with the SAP definition | Reconciled participant counts and corrected selection rules |
| Wrong percentage denominator | Recalculate selected percentages with the approved denominator | Consistent counts, percentages and footnotes |
| Incorrect derived value | Recalculate selected records using the documented baseline rules | Agreement with the approved derivation |
| Incorrect confidence interval or p-value | Verify the model, contrast, standard error and degrees of freedom | Agreement with the specified analysis |
| Inconsistent table and figure | Reconcile populations, definitions, methods and time points | Consistent analysis definitions |
| Stale output after a change | Review version history and affected deliverables | Updated output and completed rechecks |
Worked example: wrong population. The SAP specifies the full analysis set, but the program selects records with a flag for another population. The table looks plausible. Applying the five stages: confirm the population in the SAP; inspect the population flags; find the wrong selection criterion; reconcile expected and actual counts; then regenerate and recheck every output that uses the same rule. These TLF programming errors are caught by reconciling counts, not by reading the table.
08Conclusion
Reliable TLFs need more than correct formatting. A requirement-level traceability record, statistical checks and documented discrepancy resolution let reviewers connect every number to the approved analysis.
Questions
What is the difference between TLF and TFL?
None. Both mean tables, listings and figures; organisations simply use different conventions.
What should a TLF specification include?
Source datasets and variables, record-selection rules, derivations, statistical methods, denominators and presentation requirements.
What should TLF quality control check?
The population, denominators, derivations, model, contrast, confidence intervals, p-values, labels and footnotes, reconciled against approved specifications.
References
- Clinical Data Interchange Standards Consortium (CDISC). Analysis Data Model (ADaM). https://www.cdisc.org/standards/foundational/adam
- CDISC. ADaM Examples of Traceability v1.0. https://www.cdisc.org/standards/foundational/adam/adam-examples-traceability-v1-0
- CDISC. Study Data Tabulation Model (SDTM). https://www.cdisc.org/standards/foundational/sdtm
- International Council for Harmonisation. E6(R3) Guideline for good clinical practice, Step 5 (consolidated). European Medicines Agency; 2026. https://www.ema.europa.eu/en/documents/scientific-guideline/ich-e6r3-guideline-good-clinical-practice-step-5_en.pdf
- US Food and Drug Administration. Study Data Technical Conformance Guide: technical specifications document. https://www.fda.gov/regulatory-information/search-fda-guidance-documents/study-data-technical-conformance-guide-technical-specifications-document
Update log
- Published by Pubrica
How to cite this article
Dr. Charlie. (2026, October 31). TLFs in Clinical Trials: How Tables, Listings and Figures Map to Your SAP. Pubrica. https://pubrica.com/academy/biostatistics-and-statistical-programming-services/tlfs-clinical-trials-map-to-sap/
This article is general information for researchers, not legal, regulatory or funding advice. Check the current requirements of your journal, funder, ethics committee or regulator before you act on it.