The PRISMA 2020 Flow Diagram as a Flowchart: Box by Box, Who Fills It and What Each Number Means
Who completes each box of the PRISMA 2020 flowchart, when the numbers are filled in, and where systematic literature review projects stall before submission.

- Template shown
- New review, all sources
- Boxes owned by
- Information specialist, reviewers, review lead
- Kept up to date
- From the search log, day one
- Free tool
- PRISMA2020 Shiny app
Quick answer
- Give every box an owner in the protocol.
- Fill the counts as the review runs, from the search log.
- Redraw the diagram if the search is rerun before submission.
01What the PRISMA 2020 flow diagram shows
The PRISMA flow diagram depicts the flow of information through the different phases of a systematic review. It maps the number of records identified, included and excluded, and the reasons for exclusions [1]. PRISMA 2020 recommends it for reporting the search and selection process of a systematic literature review [2]. Figure 1 shows the template for a new review that searched databases and registers and other sources.
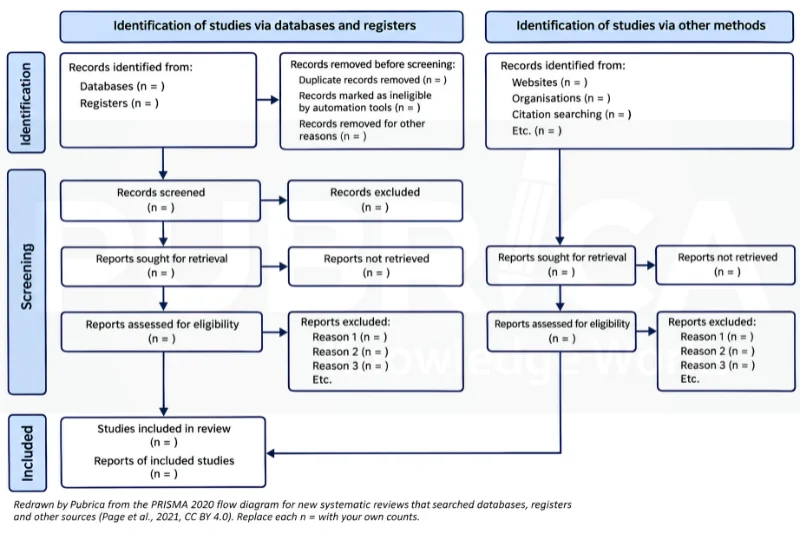
Four PRISMA templates, in Word format, are published on the PRISMA website for new and updated reviews [1], and our box-by-box PRISMA flow diagram guide explains which to choose. Diagrams can also be generated with the PRISMA2020 R package and Shiny app [3].
02Stage-by-stage notes: who fills each box
The flowchart is filled as the work proceeds, so each box has an owner in the team (Table 1). The roles below are typical, not prescribed by PRISMA; agree them in the protocol so that every count has one person accountable for it.
| Phase | Box | What it records | Typically filled by |
|---|---|---|---|
| Identification | Records identified from databases and registers | Records from each database and each register, listed separately | Information specialist |
| Identification | Records removed before screening | Duplicate records, records marked ineligible by automation tools, records removed for other reasons | Information specialist or reviewer |
| Screening | Records screened and records excluded | Title and abstract screening results | Two independent reviewers |
| Screening | Reports sought for retrieval and reports not retrieved | Full texts requested and those that could not be obtained | Reviewer or librarian |
| Screening | Reports assessed for eligibility and reports excluded | Full-text screening decisions, with a reason and a count for each reason | Two independent reviewers |
| Other methods | Records from websites, organisations, citation searching | The right-hand path, with its own retrieval and eligibility boxes | Reviewer |
| Included | Studies included and reports of included studies | Final number of studies and the reports that describe them | Review lead |
The information specialist owns the identification boxes because the counts come straight from the database exports and the search log. The screening boxes belong to the independent reviewers, and the review lead signs off the final counts once data extraction confirms which reports belong to which study.
03Time per stage
Because the diagram follows the review, its timing is the review’s timing. An archived Cochrane Handbook timeline (version 5.1.0, 2011) allowed months 3 to 8 for searching and inclusion assessments [4]. Study selection, data extraction and critical appraisal are among the most resource-intensive stages of review production, while the literature search and study retrieval take less time [5].
Keep a running count in the search log from day one, so the diagram can be drawn from the log rather than rebuilt at the end. In an evidence synthesis that feeds a dossier, record who updated each count and when.
04Where projects stall
- Numbers that do not reconcile. Each box should equal the previous box minus what left the pathway. Run the arithmetic checks before submission.
- Reports counted as studies. One study can have several reports, so the two final numbers differ.
- Missing exclusion reasons. Full-text screening exclusions need a reason and a count for each reason.
- Other sources merged into the database count. Websites, organisations and citation searching belong in their own column.
- An outdated search. If the search is rerun before submission, redraw the diagram with the new counts and record the date. An updated systematic review uses its own template.
The flowchart is the last step of systematic review reporting, not a separate task. For the full sequence from question to synthesis, see how our team runs the systematic review process.
Questions
Who should fill in the PRISMA flowchart?
Usually the information specialist fills the identification boxes, two independent reviewers fill the screening boxes, and the review lead confirms the included counts.
Can I generate the PRISMA 2020 flow diagram online?
Yes. The PRISMA2020 Shiny app produces compliant flow diagrams, and the PRISMA website provides Word templates.
When should the flowchart be completed?
Progressively. Record counts in the search log as each stage finishes, then draw the diagram from the log once screening and extraction are complete.
References
- PRISMA. PRISMA 2020 flow diagram. Accessed 3 November 2026. https://www.prisma-statement.org/prisma-2020-flow-diagram
- Page MJ, McKenzie JE, Bossuyt PM, et al. The PRISMA 2020 statement: an updated guideline for reporting systematic reviews. BMJ. 2021;372:n71. https://doi.org/10.1136/bmj.n71
- Haddaway NR, Page MJ, Pritchard CC, McGuinness LA. PRISMA2020: an R package and Shiny app for producing PRISMA 2020-compliant flow diagrams. Campbell Syst Rev. 2022;18(2):e1230. https://doi.org/10.1002/cl2.1230
- Higgins JPT, Green S, eds. Cochrane Handbook for Systematic Reviews of Interventions, version 5.1.0 (archived), Box 2.3.b: Timeline for a Cochrane review. The Cochrane Collaboration; 2011. As reproduced by University of Iowa Libraries, accessed 3 November 2026. https://guides.lib.uiowa.edu/reviewshealthsciences/timelines
- Nussbaumer-Streit B, Ellen M, Klerings I, et al. Resource use during systematic review production varies widely: a scoping review. J Clin Epidemiol. 2021;139:287-296. https://doi.org/10.1016/j.jclinepi.2021.05.019
Update log
- Published by Pubrica
How to cite this article
Dr. Charlie. (2026, November 3). The PRISMA 2020 Flow Diagram as a Flowchart: Box by Box, Who Fills It and What Each Number Means. Pubrica. https://pubrica.com/academy/systematic-review/prisma-2020-flow-diagram-flowchart-systematic-review/
This article is general information for researchers, not legal, regulatory or funding advice. Check the current requirements of your journal, funder, ethics committee or regulator before you act on it.