Thesis Poster Example for Students
Poster presentation Sample Work
Left atrial remodeling reflects diastolic dysfunction and adverse cardiac loading conditions after acute myocardial infarction. Cardiac MRI enables precise assessment of left atrial structure and function with strong prognostic implications.
This study evaluates LAVImin as a predictor of major adverse cardiovascular events following AMI.
What a thesis poster must do that a thesis chapter does not
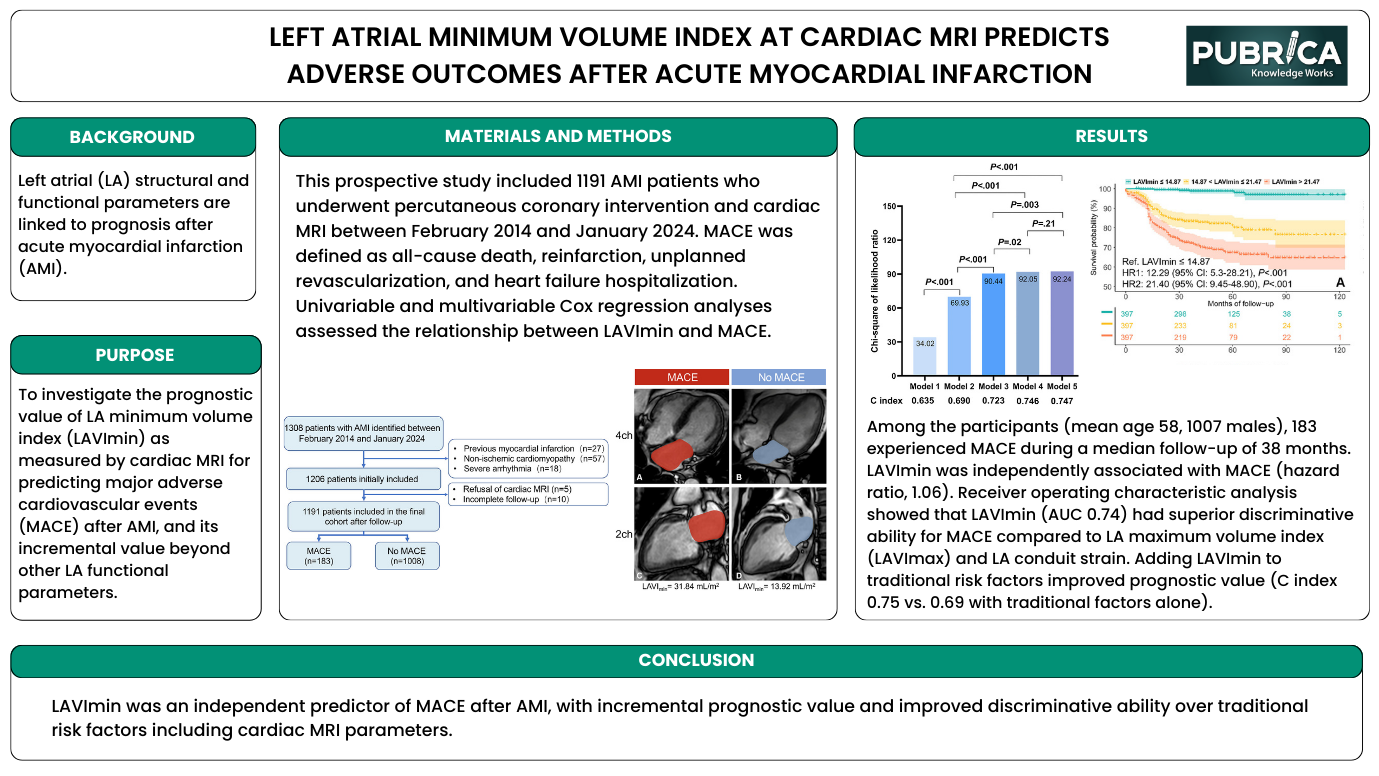
A thesis chapter can take thirty pages to set out its rationale, methods and results; a poster has one board and perhaps two minutes of a reader's attention. This sample shows how a postgraduate cardiovascular imaging project can be reduced to that format without losing its scientific logic. It presents a prospective cohort study asking whether the left atrial minimum volume index (LAVImin), measured on cardiac MRI, predicts major adverse cardiovascular events (MACE) after acute myocardial infarction (AMI).
The poster is aimed at students preparing for a departmental research day, a thesis defence display or a first conference presentation. Its layout is a horizontal board with a title banner, a narrow left column (Background and Purpose), a wide central Materials and Methods panel containing a patient flow diagram and MRI images, a Results panel with two charts and a short paragraph, and a full-width Conclusion bar.
Left atrial size after myocardial infarction: the clinical question
After a myocardial infarction, the left ventricle often stiffens and filling pressures rise. The left atrium, which empties into the ventricle, is exposed to that pressure and tends to enlarge and lose function over time, so atrial size and performance can act as a barometer of diastolic dysfunction and adverse loading. The poster's Background states this concisely: left atrial structural and functional parameters are linked to prognosis after AMI.
Most clinical work has used the maximum left atrial volume, measured at the end of ventricular systole. The minimum volume, measured at end-diastole when the atrium has emptied, is more directly exposed to ventricular filling pressure, which is one reason it has attracted interest as a prognostic marker. Cardiac MRI allows both volumes to be measured precisely. The Purpose panel accordingly sets two aims: to test the prognostic value of LAVImin for MACE, and to establish its incremental value beyond other left atrial functional parameters.
Following the patient flow and the imaging panels
The Methods panel combines text with two visual elements. The text reports a prospective study of 1,191 patients with AMI who underwent percutaneous coronary intervention and cardiac MRI between February 2014 and January 2024, with MACE defined as all-cause death, reinfarction, unplanned revascularisation and hospitalisation for heart failure, analysed with univariable and multivariable Cox regression.
The flow diagram traces how that cohort was formed: 1,308 patients identified; exclusions for previous myocardial infarction (27), non-ischaemic cardiomyopathy (57) and severe arrhythmia (18), leaving 1,206; further exclusions for refusal of MRI (5) and incomplete follow-up (10); and a final cohort split into 183 patients with MACE and 1,008 without. Alongside it, four cine MRI frames in four-chamber and two-chamber views show the left atrium shaded in two example patients, one with MACE (LAVImin 31.84 mL/m²) and one without (13.92 mL/m²), giving viewers an immediate sense of what the measurement looks like.
The Results paragraph reports a mean age of 58 years, 1,007 men, and 183 MACE over a median follow-up of 38 months. LAVImin was independently associated with MACE (hazard ratio 1.06), discriminated better than maximum volume index or conduit strain (area under the curve 0.74), and improved the C index from 0.69 with traditional risk factors to 0.75.
Hazard ratios, C index and likelihood ratio bars, briefly explained
The two charts use statistics that students often find hard to present. The bar chart shows the chi-square of the likelihood ratio for five nested models (34.02, 69.93, 90.44, 92.05 and 92.24), with the C index beneath each bar (0.635 to 0.747). Rising bars mean each added variable improves model fit; brackets with p-values show which steps are significant, and the final step is not (P = .21), which helps readers see where added information plateaus. The C index measures discrimination, the probability that the model ranks a patient who has an event above one who does not.
The Kaplan–Meier panel divides patients into three LAVImin groups (≤14.87, 14.87–21.47 and >21.47 mL/m²) and shows event-free survival separating early and widely, with a numbers-at-risk table beneath and hazard ratios against the lowest group of 12.29 and 21.40. For a cohort study of this kind, the STROBE statement is the relevant reporting guideline, and the flow diagram, follow-up duration and outcome definition all address its items. When reporting a hazard ratio for a continuous measure, stating the unit of change is good practice, as a ratio of 1.06 is only interpretable per defined increment.
Converting your own thesis into a board like this
Students can borrow several of this poster's habits:
- Limit the background to one or two sentences and give the purpose its own box.
- Let a flow diagram replace paragraphs of inclusion and exclusion criteria.
- Include one example image that shows the measurement itself.
- Pair a single explanatory paragraph with no more than two charts.
- Write a conclusion that restates the answer to the purpose, without new data.
A common mistake in thesis posters is reproducing every table from the dissertation; this sample instead chooses the two figures that answer its two aims. Pubrica's poster preparation service helps students and researchers make those choices and lay out the board, biostatistics support can check survival and discrimination analyses before they are displayed, and scientific editing can tighten the wording of each panel.
Questions about this sample
What study design is shown in this thesis poster?
It is a prospective cohort study of 1,191 patients with acute myocardial infarction treated with percutaneous coronary intervention and imaged with cardiac MRI between February 2014 and January 2024. Patients were followed for major adverse cardiovascular events, with a median follow-up of 38 months, and Cox regression was used for analysis.
What do the MRI images in the methods panel show?
They are four-chamber and two-chamber cine frames with the left atrium shaded, comparing a patient who had a major adverse event (LAVImin 31.84 mL/m²) with one who did not (13.92 mL/m²). They illustrate what the measurement represents and make the size difference visible at a glance.
Why does the poster report a C index?
The C index measures how well a model distinguishes patients who experience an event from those who do not. The poster shows it rising from 0.69 with traditional risk factors to 0.75 when LAVImin is added, supporting the claim that the measurement adds prognostic information beyond established predictors.
How many patients were excluded and why?
Of 1,308 patients identified, 102 were excluded for previous myocardial infarction, non-ischaemic cardiomyopathy or severe arrhythmia, and a further 15 for refusing cardiac MRI or incomplete follow-up. The flow diagram shows each exclusion step, leaving a final cohort of 1,191.

Give yourself the academic edge today
Each order includes
- On-time delivery or your money back
- A fully qualified writer in your subject
- In-depth proofreading by our Quality Control Team
- 100% confidentiality, the work is never re-sold or published
- Standard 7-day amendment period
- A paper written to the standard ordered
- A detailed plagiarism report
- A comprehensive quality report
Enquire Now