
- Services
- Discovery & Intelligence Services
- Publication Support Services
- Sample Work

Publication Support Service
- Editing & Translation
-
Editing and Translation Services
- Sample Work

Editing and Translation Service
-
- Research Services
- Sample Work
Research Services
- Physician Writing
- Sample Work

Physician Writing Service
- Statistical Analyses
- Sample Work
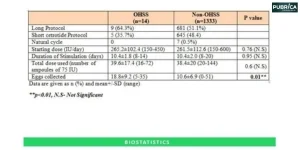
Statistical Analyses
- Data Collection
- AI and ML Services
- Sample Work

AI and ML Services
- Medical Writing
- Sample Work
Medical Writing
- Research Impact
- Sample Work

Research Impact
- Medical & Scientific Communication
- Sample Work

Medical & Scientific Communication
- Medico Legal Services
- Educational Content
- Academic Editorial Services
- Sample Work
Academic Editorial Services
- Educational Editorial Service
-
Education Editorial Services
- Sample Work
Education Editorial Services
-
- Industries
- Subjects
- About Us
- Academy
- Insights
- Contact Us
Targeted literature searches are a fundamental part of writing clinical manuscripts that will meet the standards of high-quality journals and contribute meaningfully to evidence-based practice. When physicians write clinical manuscripts, utilizing a targeted literature search can identify high-quality, relevant, and current evidence. While a general literature review is useful, a targeted literature search is specific to the clinical question and should be completed through frameworks established, such as PICO (Population, Intervention, Comparator, Outcome) and PRISMA [1].
Biostatistics in Practice: From Data Collection to Analysis
- Home
- Academy
- Research Impact
- Biostatistics in Practice: From Data Collection to Analysis
High-Impact Journals
Interesting topics
Biostatistics in Practice: From Data Collection to Analysis
1. What are Biostatistics?
2. Why is Biostatistics Important?
3. Types of Data in Biostatistics
4. Descriptive Statistics
5. Data Visualization Techniques
6. Common Statistical Terms
7. Inferential Statistics: Drawing Conclusions
8. Common Statistical Tests
9. Common Mistakes in Biostatistics
10. Conclusion
In today’s evidence-based scientific environment, biostatistics is an invaluable resource for anyone involved in medical, biological, or public health research. It doesn’t matter if you are performing an analysis of a clinical trial, studying a public health intervention, or examining data-generating use cases in genetics; biostatistics helps make sense of complicated and often unclear data.[1]
In medical research data collection techniques, and life sciences research, biostatistics ensures data accuracy and validity from the start of the study design.
1. What are Biostatistics?
Biostatistics is the application of statistical methods to biological and health-related studies. It is fundamental to the design of experiments, the collection of data, the analysis of results, and the decision-making that occurs because of data in medical, environmental, and public health arenas.[2]
2. Why is Biostatistics Important?
Biostatistics assists in: [3]
- Identifying patterns in biological data
- Designing valid clinical studies
- Assessing treatment effectiveness
- Informed public health decision making
- Authors in publishing believable research – justified through data analysis.
Example: Biostatistics guides the decision on how many participants to use for testing a new drug, how to randomize, and how to tell if it really works. It also supports data collection, sample size, and medical study planning, and helps choose the data collection method for healthcare research appropriately.
3. Types of Data in Biostatistics
Correct data classification is the foundation for accurate analysis. Data in biostatistics fall into four main categories: [4]
Data Type | Description | Examples |
Nominal | Categorical, no inherent order | Gender, Blood type |
Ordinal | Categorical, ordered | Pain level (low, medium, high) |
Interval | Numeric, equal intervals, no true zero | Temperature in Celsius |
Ratio | Numeric with a true zero | Height, Weight, Age |
These classifications guide both quantitative data collection methods for biomedical researchers and qualitative data collection in life sciences studies.
4. Descriptive Statistics
Descriptive statistics summarize your information to help you understand the centre, spread, and distribution of your dataset.[5]
| Measures of Central Tendency | Measures of Dispersion |
|---|---|
| • Mean: Average value • Median: Middle value • Mode: Most frequent value | • Range: Difference between the highest and lowest • Standard Deviation (SD): Spread about the mean • Variance: The square of SD • Interquartile Range (IQR): Range between the 25th and 75th percentile |
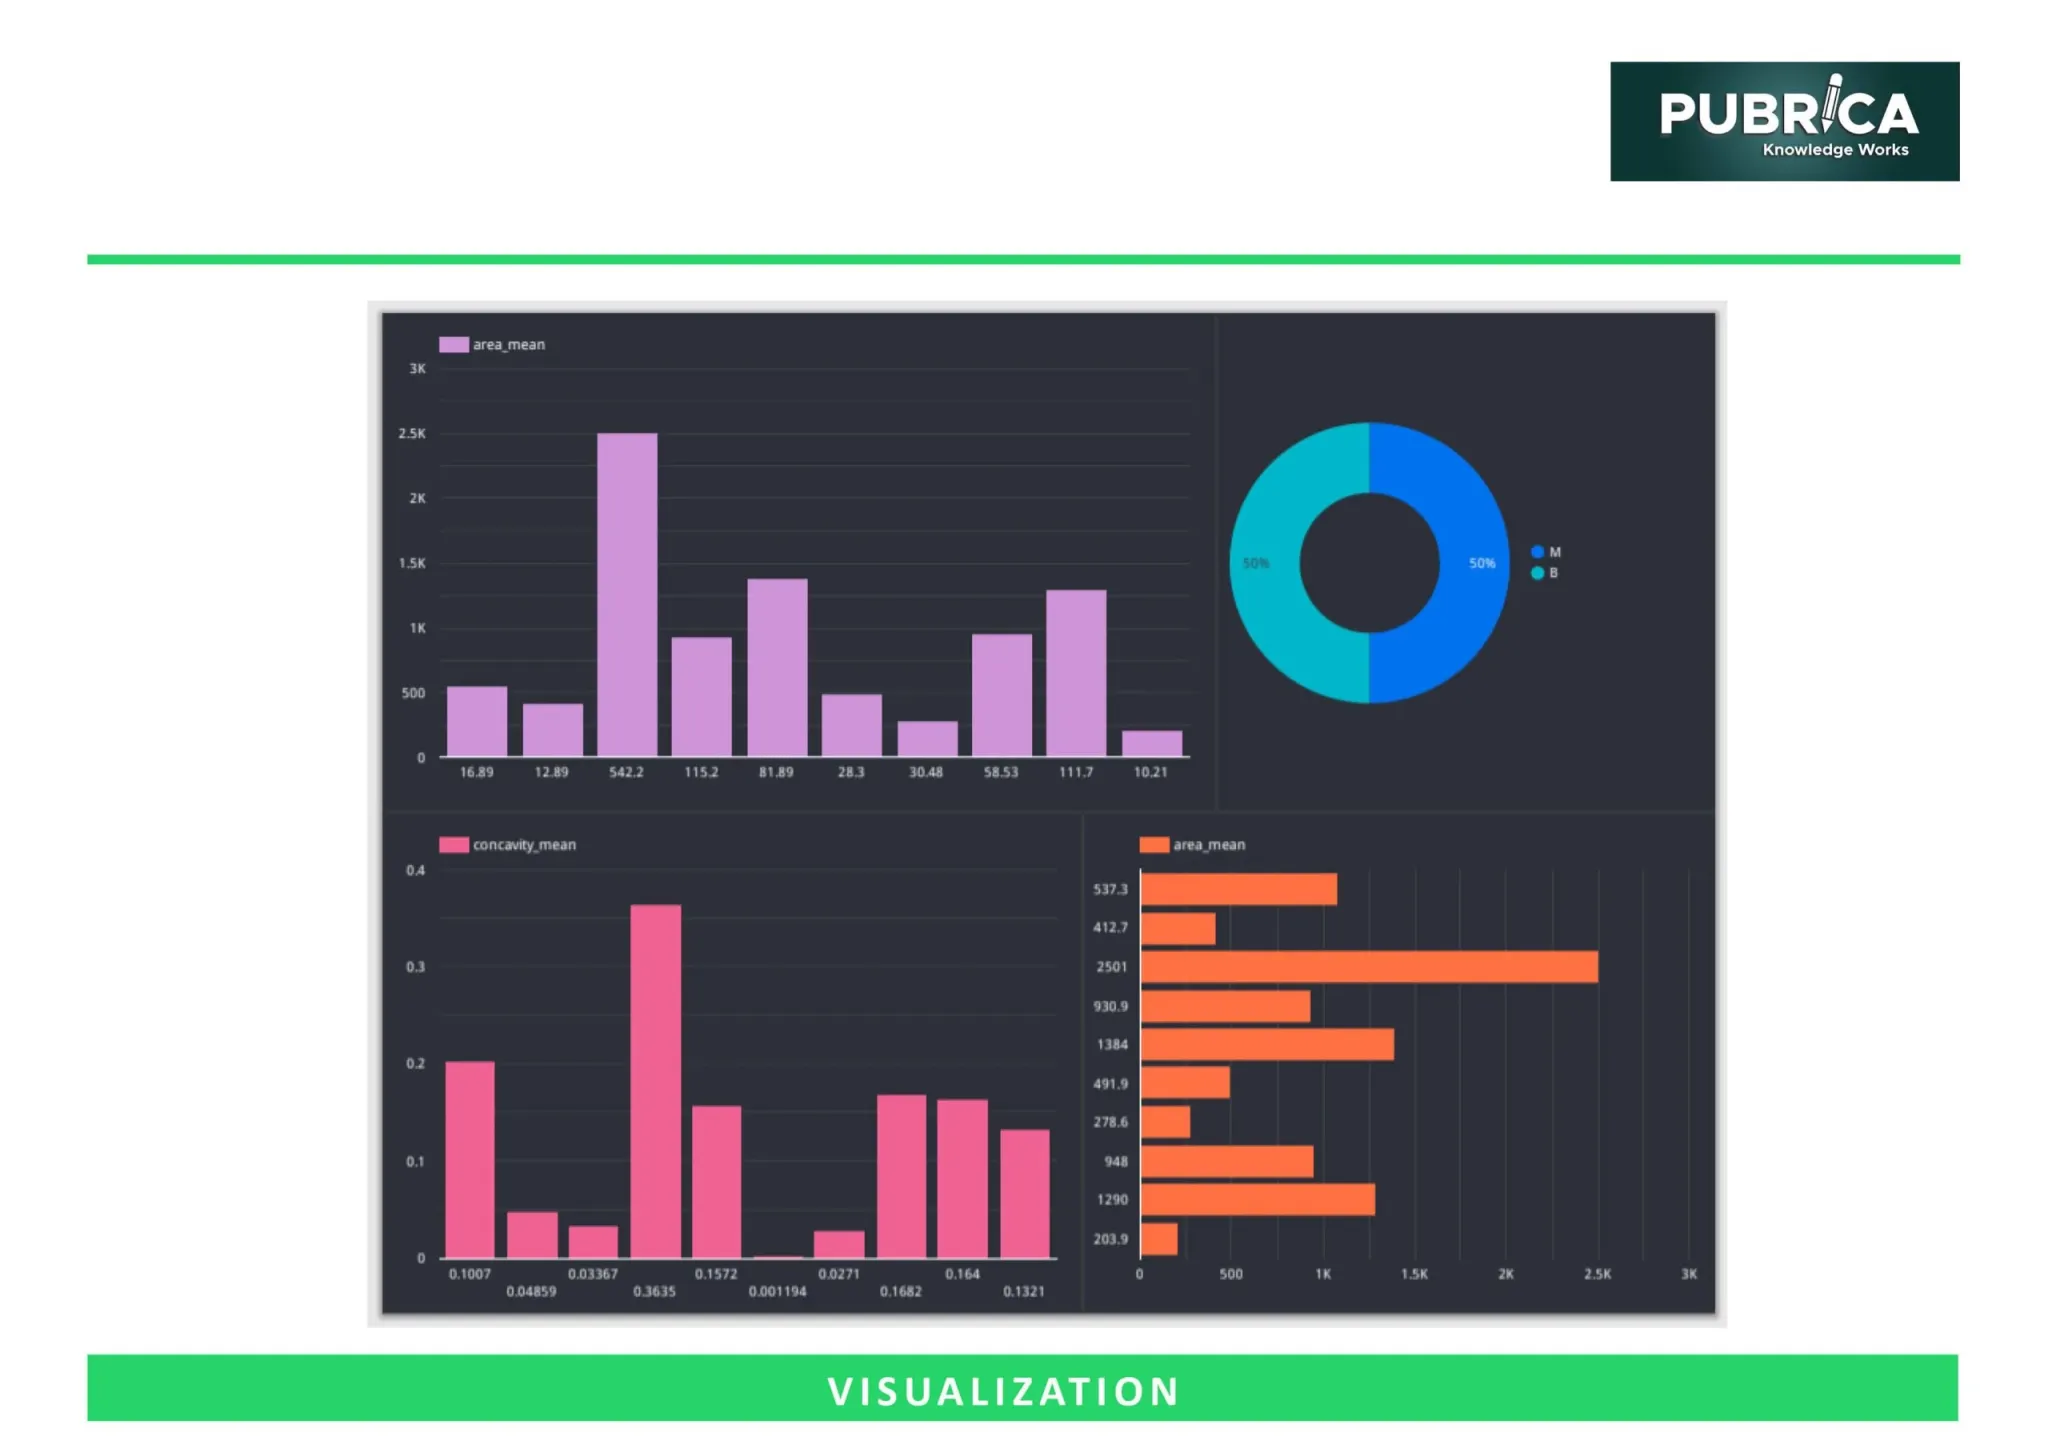
5. Data Visualization Techniques
Graphs and plots help identify trends, spot outliers, and communicate results clearly. Visualization is crucial when summarizing both experimental data collection in life sciences and observational data collection methods in healthcare.
Graph Type | Best for | Example |
Histogram | Continuous data | Blood pressure distribution |
Bar chart | Categorical data | Disease prevalence by region |
Box plot | Comparing groups | Cholesterol levels in men vs women |
Scatter plot | Correlation between 2 variables | Age vs Blood Sugar Levels |
6. Common Statistical Terms
Term | Definition | Example |
Population | The entire group under study | All diabetics in the US |
Sample | Subset of the population | 500 diabetic patients from hospitals |
Variable | Measured attribute | Blood glucose, Age |
Parameter | Summary value for population | True average BMI |
Statistic | Summary from a sample | Sample mean BMI |
These terms are fundamental in both primary vs secondary data in medical research and experimental studies across healthcare disciplines.
7. Inferential Statistics: Drawing Conclusions
Researchers utilize inferential statistics to make predictions or decisions about a population based on some sample data. It is central to surveys, interviews, observations in medical research, and experimental data interpretation. [6]
7.1. Testing of Hypotheses
- Null Hypothesis (H₀): No effect or no difference exists [7]
- Alternative Hypothesis (H₁): An effect or difference exists
- p-value: Probability that the observed data occurred by chance [8]
- Confidence Interval (CI): Range of the most likely values to contain the true effect. If p < 0.05 → A Significant result has been found.
8. Common Statistical Tests
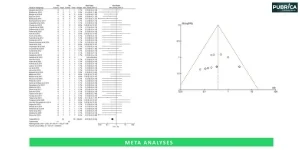
Use parametric tests for normally distributed data and non-parametric tests otherwise. These tests are fundamental tools in both statistical analyses and meta-analyses.
Test | Used For | Example |
t-test | Comparing two means | Drug A vs Drug B on blood pressure |
Chi-square | Comparing categorical variables | Smoking status vs disease presence |
ANOVA | Comparing 3+ groups | Cholesterol across age groups |
Correlation (r) | Strength of the relationship | Height vs Weight |
Regression | Predicting outcomes | Predicting BP from age and weight |
9. Common Mistakes in Biostatistics
- Misunderstanding p-values as evidence
- Disregarding effect sizes
- Utilizing a test that is incorrect for the measurement scale
- Cherry-picking outcomes
- Failing to check the normality of the data
- Ignoring methods for handling missing data.
Connect with us to explore how we can support you in maintaining academic integrity and enhancing the visibility of your research across the world!
Conclusion
Biostatistics is integral in research in the life sciences, medicine, and public health. This introductory module provided a conceptual foundation of fundamental ideas, from types of data and descriptive statistics to visualisation and basic statistical tests. It is important to know how to classify your data, how to summarise it effectively, and how to choose a relevant statistical test to produce valid, reproducible, and interpretable research.
Biostatistics in Practice: From Data Collection to Analysis. Our Pubrica consultants are here to guide you. [Get Expert Publishing Support] or [Schedule a Free Consultation]
References
- Ali, Z., & Bhaskar, S. B. (2016). Basic statistical tools in research and data analysis. Indian journal of anaesthesia, 60(9), 662–669. https://doi.org/10.4103/0019-5049.190623
- Hazra, A., & Gogtay, N. (2016). Biostatistics Series Module 1: Basics of Biostatistics. Indian journal of dermatology, 61(1), 10–20. https://doi.org/10.4103/0019-5154.173988
- Zapf, A., Rauch, G., & Kieser, M. (2020). Why do you need a biostatistician?. BMC medical research methodology, 20(1), 23. https://doi.org/10.1186/s12874-020-0916-4
- Ranganathan, P., & Gogtay, N. J. (2019). An Introduction to Statistics – Data Types, Distributions and Summarizing Data. Indian journal of critical care medicine: peer-reviewed, official publication of Indian Society of Critical Care Medicine, 23(Suppl 2), S169–S170. https://doi.org/10.5005/jp-journals-10071-23198
- Kaliyadan, F., & Kulkarni, V. (2019). Types of Variables, Descriptive Statistics, and Sample Size. Indian dermatology online journal, 10(1), 82–86. https://doi.org/10.4103/idoj.IDOJ_468_18
- Guetterman T. C. (2019). Basics of statistics for primary care research. Family medicine and community health, 7(2), e000067. https://doi.org/10.1136/fmch-2018-000067
- Pernet C. (2015). Null hypothesis significance testing: a short tutorial. F1000Research, 4, 621. https://doi.org/10.12688/f1000research.6963.3
- Andrade C. (2019). The PValue and Statistical Significance: Misunderstandings, Explanations, Challenges, and Alternatives. Indian journal of psychological medicine, 41(3), 210–215. https://doi.org/10.4103/IJPSYM.IJPSYM_193_19