


What Is Statistical and Contextual Interpretation in Research Studies?
- Home
- Research Services
- Systematic Review
- What Is Statistical and Contextual Interpretation in Research Studies?
High-Impact Journals
- What Is Statistical Interpretation in Research?
- What Is Contextual Interpretation in Research?
- Why Both Statistical and Contextual Interpretation Matter
- Practical Example of Interpretation in Research
- Common Mistakes in Statistical and Contextual Interpretation
- Best Practices for Accurate Research Interpretation
Interesting topics
What Is Statistical and Contextual Interpretation in Research Studies?
Knowledge and comprehension of research findings are not limited to understanding numbers. There is more to research findings than just their statistical interpretation. Statistical interpretation and contextual interpretation are two basic methods for interpreting research findings, and both methods help in drawing accurate research conclusions. Explore this article for a statistical analysis explained, helping you better understand research findings and apply them effectively in real-world contexts.
1. What Is Statistical Interpretation in Research?
Statistical interpretation is defined as a process of analysing the research data, where the researcher uses statistical tests to determine if the research results are significant, precise, and generalizable.[1]
Key Elements of Statistical Interpretation
- P-values: These are used to determine if the results were due to chance
- Confidence Interval (CI): This is used to determine the precision of the results
- Effect Size: This is used to determine the strength of the association
- Statistical Power: This is used to determine the strength of the association
- Model Fit Indicators: These are used to determine the fit of the data to the statistical model.[2]
THE INSIGHT:
A statistically significant result (for example, p < 0.05) does not necessarily mean that the result is practically important
Common Statistical Indicators and Their Meaning
| Indicator | Purpose | Interpretation Tip |
|---|---|---|
| P-value | Tests statistical significance | Lower values suggest stronger evidence |
| Confidence Interval | Shows estimate precision | Narrow intervals indicate higher precision |
| Effect Size | Measures strength of relationship | Larger values imply stronger effects |
| R-squared | Explains variance in regression models | Higher values indicate better model fit |
2. What Is Contextual Interpretation in Research?
Contextual interpretation is where the research results are placed within the broader context of theory, environment, population, and application.
Key Components of Contextual Interpretation
- Study Population: Age group, gender, cultural group
- Research Setting: Clinical setting, lab setting, or field setting
- Theoretical Framework: Theories that guide the research
- External Validity: How the research can be applied to other populations
- Socioeconomic and Cultural Factors
For Example:
A drug may have statistically significant results in a controlled clinical setting but may have limited results in the real world.
Statistical vs Contextual Interpretation
| Method | Description | Typical Use |
| Bayesian Models | Use probability distributions and prior information | Complex treatment networks |
| Frequentist Models | Use traditional statistical inference | Large clinical datasets |
| Mixed Treatment Comparison | Combines direct and indirect evidence | Multi-arm trials |
3. Why Both Statistical and Contextual Interpretation Matter
Relying solely on statistical interpretation may result in false conclusions, and failing to consider statistical rigor may result in false validity. The integration of the two will ensure:
- Balanced conclusions
- Improved decision-making
- Improved research transparency
- Improved research reproducibility
This highlights the importance of data interpretation in research studies for reliable outcomes. Evidence-based practice relies on statistically sound data and meaningful insights.[3]
4. Practical Example of Interpretation in Research
Assume a study on the effects of a novel teaching approach:
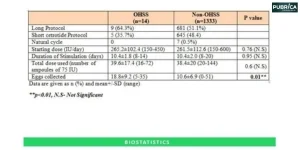
- Statistical Interpretation: Findings reveal a significant increase in students’ scores. In other words, a significant difference is observed in students’ scores. The significance level is 0.03, and effect size is 0.5.
- Contextual Interpretation: This study was implemented in a high-resource school with small class sizes. Thus, the generalizability of such a study to other institutions is limited.
This example reflects a broader research data analysis guide for interpreting results effectively. While the method is effective statistically, its broader applicability requires further validation.[4]
5. Common Mistakes in Statistical and Contextual Interpretation
- Overreliance on the use of p-values
- Overlooking the effect size
- Overlooking the limitations of the studies
- Overgeneralizing
- Confusing correlation with causation [5]
These errors often arise when comparing statistical vs contextual analysis without proper balance.
6. Best Practices for Accurate Research Interpretation
- Integrating statistical and contextual knowledge
- Specifying the effect size
- Specifying the context
- Specifying the limitations
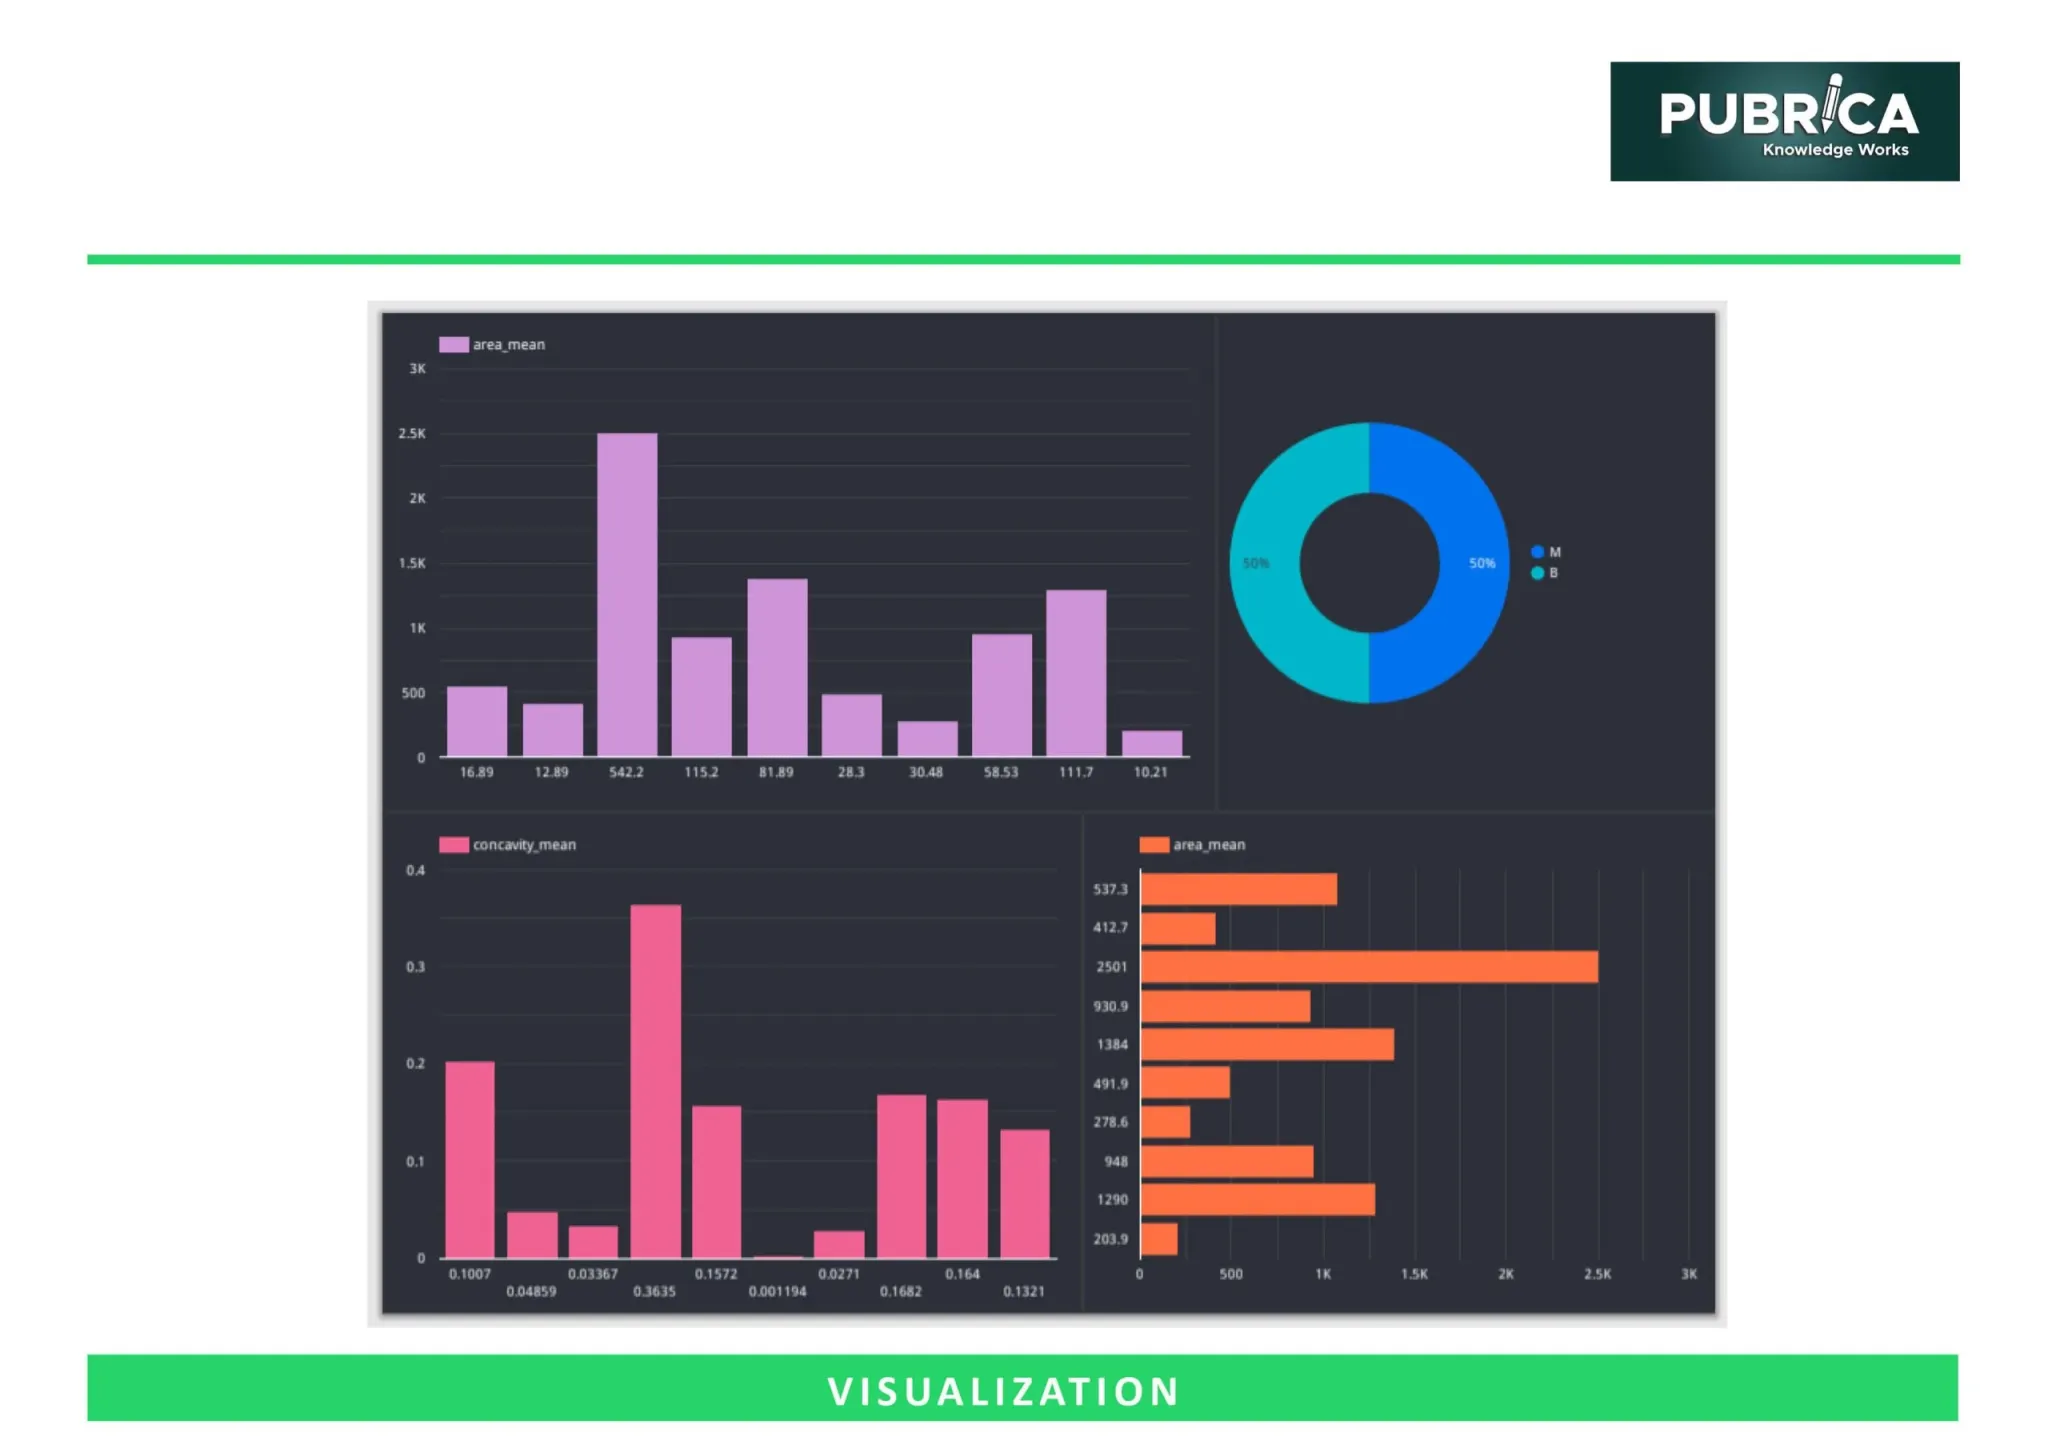
- Specifying the use of visualisations
Connect with us to explore how we can support you in maintaining academic integrity and enhancing the visibility of your research across the world!
Conclusion
Statistical and contextual interpretation together provide a complete understanding of research findings. While statistical analysis ensures accuracy, contextual interpretation adds real-world meaning. Using both approaches helps avoid misleading conclusions and supports balanced, practical, and evidence-based insights for better decision-making.
Turn your research findings into powerful, publishable insights. Get expert support to enhance your data interpretation, statistical accuracy, and real-world relevance with Pubrica. [Get Expert Publishing Support] or [Schedule a Free consultation]
References
- Schober, P., Bossers, S. M., & Schwarte, L. A. (2018). Statistical Significance Versus Clinical Importance of Observed Effect Sizes: What Do P Values and Confidence Intervals Really Represent?. Anesthesia and analgesia, 126(3), 1068–1072. https://doi.org/10.1213/ANE.00000
- Wilcox, R. R., & Serang, S. (2017). Hypothesis Testing, pValues, Confidence Intervals, Measures of Effect Size, and Bayesian Methods in Light of Modern Robust Techniques. Educational and psychological measurement, 77(4), 673–689. https://doi.org/10.1177/0013164416
- Ahern, T. P., MacLehose, R. F., Haines, L., Cronin-Fenton, D. P., Damkier, P., Collin, L. J., & Lash, T. L. (2021). Improving the transparency of meta-analyses with interactive web applications. BMJ evidence-based medicine, 26(6), 327–332. https://doi.org/10.1136/bmjebm-2019-111308
- Murad, M. H., Katabi, A., Benkhadra, R., & Montori, V. M. (2018). External validity, generalisability, applicability and directness: a brief primer. BMJ evidence-based medicine, 23(1), 17–19. https://doi.org/10.1136/ebmed-2017-110800
- Cano-Corres, R., Sánchez-Álvarez, J., & Fuentes-Arderiu, X. (2012). The effect size: Beyond statistical significance. eJIFCC, 23(1), 19–23. https://pmc.ncbi.nlm.nih.gov