
- Services
- Discovery & Intelligence Services
- Publication Support Services
- Sample Work
Publication Support Service
- Editing & Translation
-
Editing and Translation Services
- Sample Work

Editing and Translation Service
-
- Research Services
- Sample Work
Research Services
- Physician Writing
- Sample Work

Physician Writing Service
- Statistical Analyses
- Sample Work
Statistical Analyses
- Data Collection
- AI and ML Services
- Sample Work
AI and ML Services
- Medical Writing
- Sample Work
Medical Writing
- Research Impact
- Sample Work
Research Impact
- Medical & Scientific Communication
- Sample Work

Medical & Scientific Communication
- Medico Legal Services
- Educational Content
- Academic Editorial Services
- Sample Work
Academic Editorial Services
- Educational Editorial Service
-
Education Editorial Services
- Sample Work
Education Editorial Services
-
- Industries
- Subjects
- About Us
- Academy
- Insights
- Contact Us
Targeted literature searches are a fundamental part of writing clinical manuscripts that will meet the standards of high-quality journals and contribute meaningfully to evidence-based practice. When physicians write clinical manuscripts, utilizing a targeted literature search can identify high-quality, relevant, and current evidence. While a general literature review is useful, a targeted literature search is specific to the clinical question and should be completed through frameworks established, such as PICO (Population, Intervention, Comparator, Outcome) and PRISMA [1].
How to Use Visual Tools to Enhance Research Impact
- Home
- Academy
- Research Impact
- How to Write Research Protocols and Proposals for Academic and Clinical Research
Visual Tools to Enhance Research Impact
Interesting topics
How to Use Visual Tools to Enhance Research Impact
1. Why Visual Tools Matter in Research Dissemination
2. Benefits of Visual Tools in Research Communication
3. Types of Visual Tools and How to Use Them
4. Strategic Use of Visual Tools Across Research Stages
5. How to Design Effective Research Visuals
6. Common Mistakes to Avoid
7. Recommendations for Researchers
8. Conclusion
9. References
Visual communication plays a critical role in amplifying the reach, clarity, and memorability of scientific research. In an increasingly digital and interdisciplinary academic environment, researchers must move beyond traditional text-heavy dissemination. Visual tools such as infographics, graphical abstracts, data visualizations, and video summaries enable researchers to convey complex findings clearly and efficiently, attract non-specialist audiences, and increase citation potential.
This article outlines the effective use of visual tools to enhance research impact, including the types of tools, practical implementation strategies, and benefits.
1. Why Visual Tools Matter in Research Dissemination
Visual tools:
- Increase the accessibility of scientific findings
- Improve reader retention and comprehension [1]
- Boost online visibility and social media sharing
2. Benefits of Visual Tools in Research Communication
| Visual Tool Type | Primary Use | Impact on Research Visibility |
| Infographics | Simplify key findings | Increased social media shares |
| Graphical Abstracts | Summarize methods and results visually | Higher article views and downloads |
| Scientific Posters | Present work at conferences | Greater peer engagement |
| Data Visualizations | Display complex data effectively | Enhanced comprehension and citations |
| Video Abstracts | Explain research in 60–90 seconds | Better engagement on digital platforms |
3. Types of Visual Tools and How to Use Them
3.1. Infographics
Infographics are research results presented in an easy but visually appealing format. They are a combination of text, icons, and graphs that can tell stories about the most important results.
Best Practices:
- Use concise language and minimal jargon.
- Highlight only 3–4 key findings.
- Apply consistent visual hierarchy and colour schemes.
3.2. Graphical Abstracts
A graphical abstract is a single visual representation of a research article. Many journals, including Elsevier, now mandate graphical abstracts during submission.
Checklist for Creating an Effective Graphical Abstract:
- Clearly illustrate the study objective, methodology, and outcome.
- Ensure readability at small sizes.
- Maintain journal-specific dimensions and file format (e.g., JPEG, TIFF).
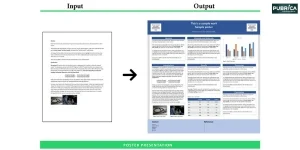
Example of Graphical Abstract

Figure 1: Adapted from Speich, B., Logullo, P., Deuster, S., Marian, I. R., Moschandreas, J., Taji Heravi, A., Gloy, V., Briel, M., Hopewell, S., & MAking Randomized Trials Affordable (MARTA) Group. (2021). A meta-research study revealed several challenges in obtaining placebos for investigator-initiated drug trials. Journal of Clinical Epidemiology, 131, 70–78. https://doi.org/10.1016/j.jclinepi.2020.11.007
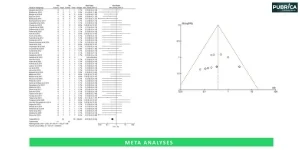
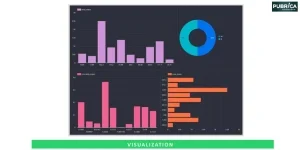
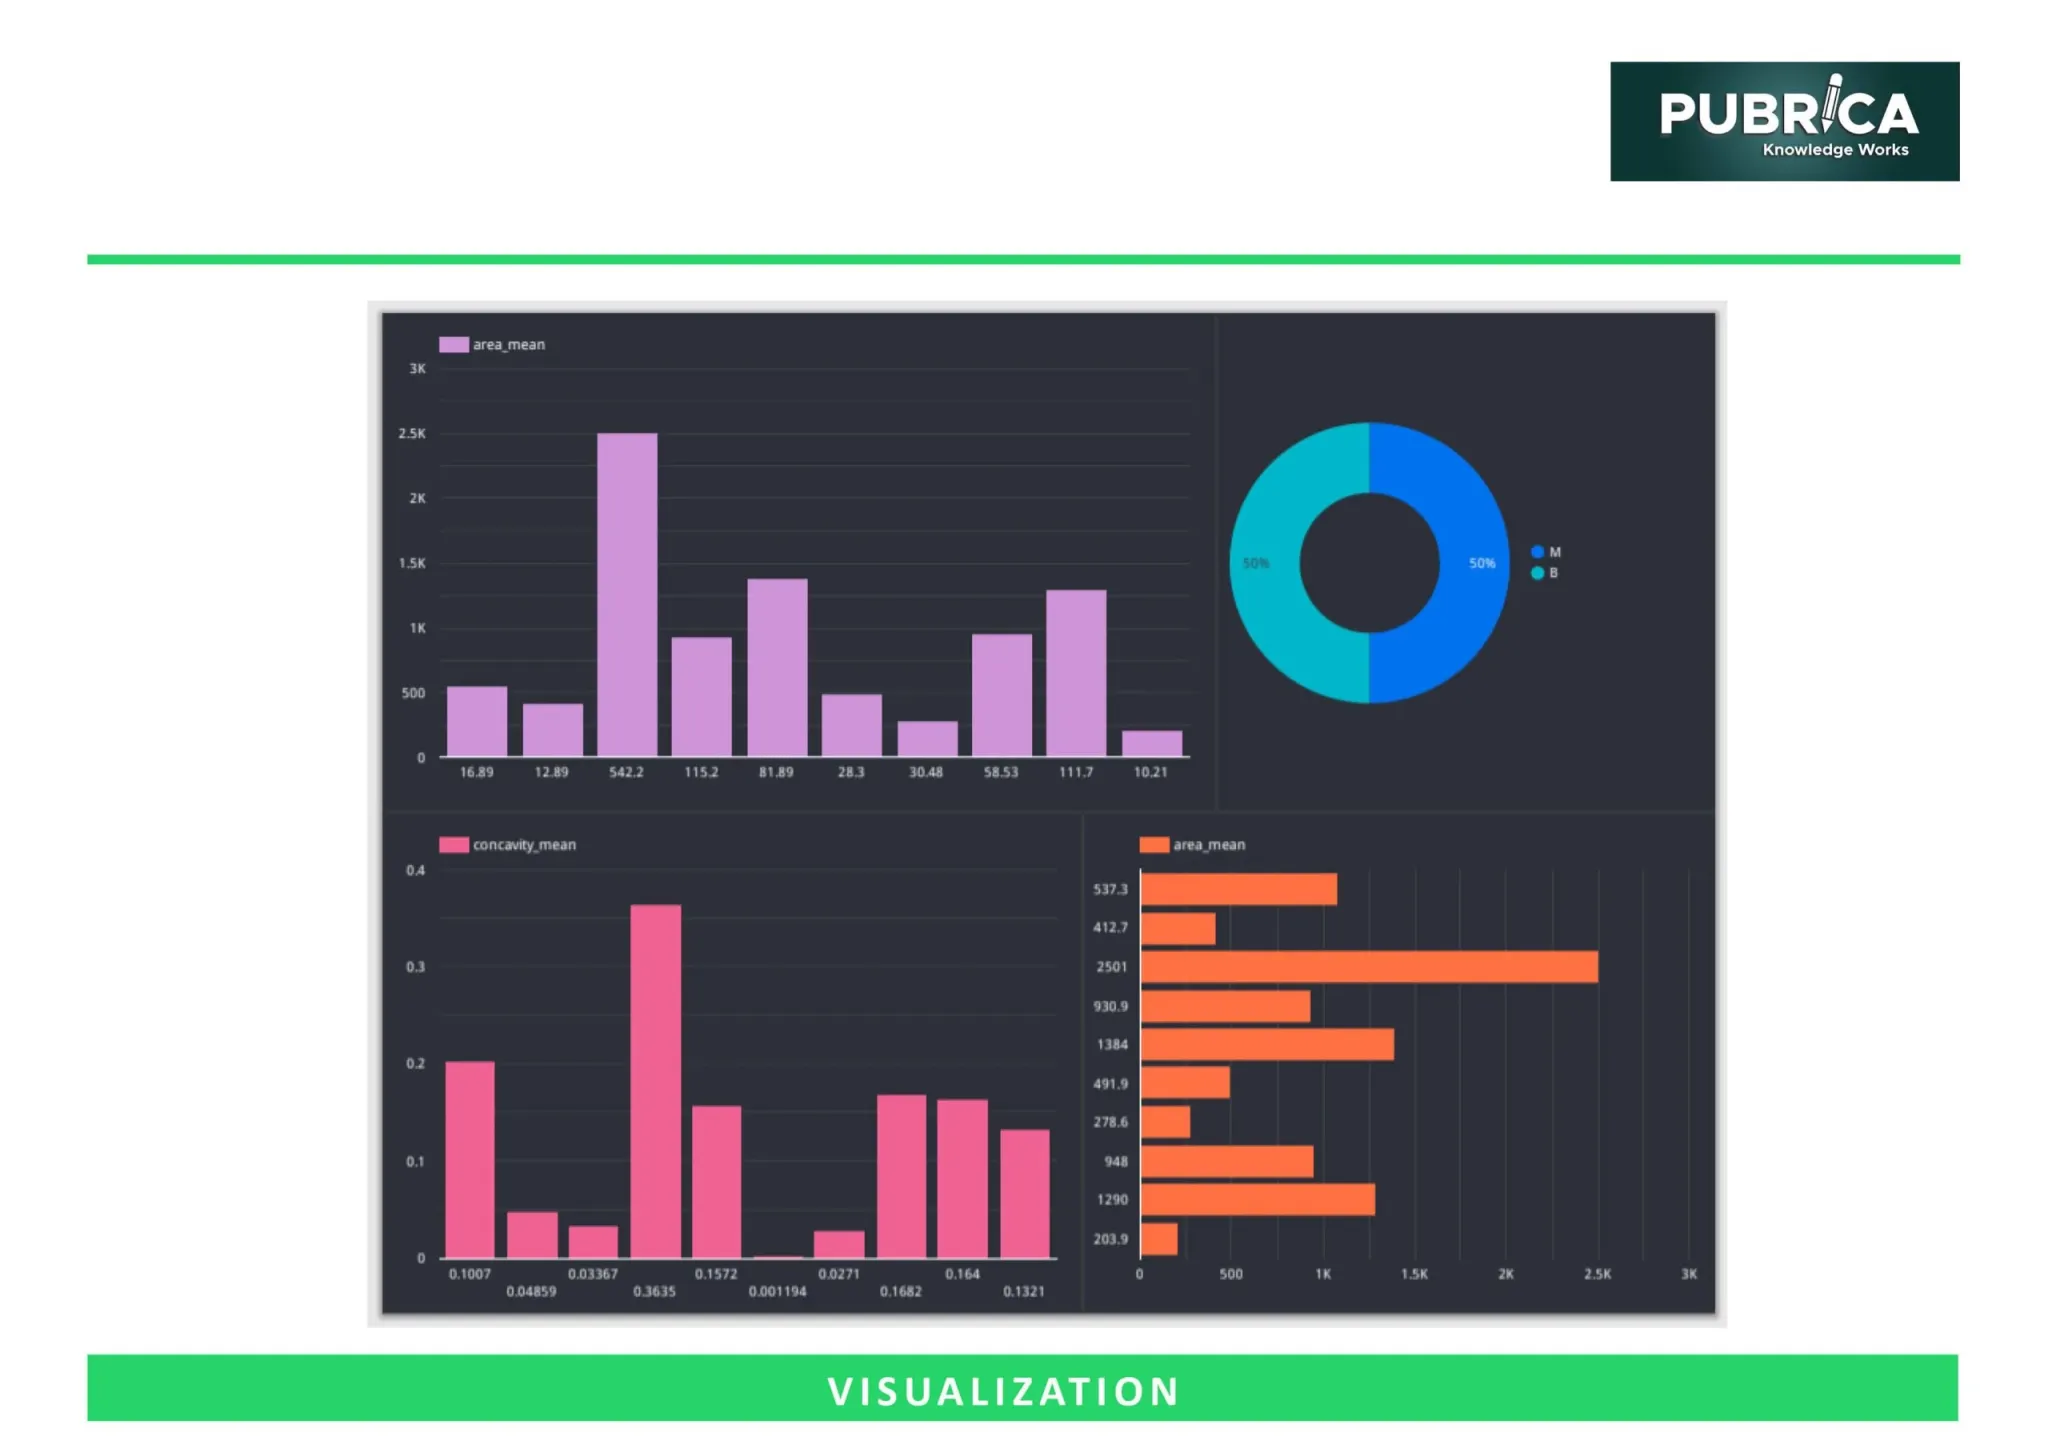
3.3. Data Visualizations
These include bar charts, scatter plots, heat maps, and network graphs that help interpret statistical and experimental data.
Tips:
- Choose appropriate chart types for the data.
- Label axes and data points.
- Avoid chart junk (unnecessary decoration that distracts).
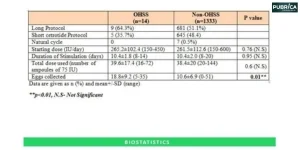
Example of Data Visualizations

Figure 2: Number of studies used and pooled prevalence by geopolitical zone. Adapted from Olamoyegun, M. A., Alare, K., Afolabi, S. A., Aderinto, N., & Adeyemi, T. (2024). A systematic review and meta-analysis of the prevalence and risk factors of type 2 diabetes mellitus in Nigeria. Clinical Diabetes and Endocrinology, 10(1), 43. https://doi.org/10.1186/s40842-024-00209-1
3.4. Video Abstracts and Explainers
An average video abstract lasts 60–90 seconds and consists of narration, visuals, and on-screen text. To support video uploads, there are a variety of platforms such as YouTube, Vimeo, and a journal website.
Video Abstracts Structure:
- Hook (problem statement)
- Summary of methods
- Key results
- Implications or applications
Tools for Creating:
- Software: Powtoon, Adobe Premiere, Camtasia
- Scripting Tip: Use short sentences (~12-15 words) and a standard voice-over.
4. Strategic Use of Visual Tools Across Research Stages
| Research Stage | Visual Tools | Purpose |
| Proposal Development | Flowcharts, conceptual frameworks | Clarify the hypothesis and study design |
| Data Analysis | Charts, dashboards | Improve interpretability and pattern detection |
| Manuscript Submission | Graphical abstracts, visual tables | Meet journal requirements and increase acceptance chances |
| Post-publication | Infographics, video explainers, and visual summaries | Enhance visibility and reach beyond academia |
5. How to Design Effective Research Visuals
5.1. Align with Objectives
- Clearly define the target audience: academics, policymakers, clinicians, or the public.
- Example: Use plain visuals and less jargon when targeting public health officials.
5.2. Use Readable Layouts and Colour Schemes
- Follow visual hierarchy (left to right, top to bottom).
- Use colour palettes for accessibility (ColorBrewer or Adobe Colour).
- Example: Use contrasting tones for different datasets in a bar graph.
5.3. Apply Design Tools
| Tool | Best For | Features |
| BioRender | Biological pathways & cell models | Drag-and-drop interface, journal-ready exports |
| Canva | Infographics & posters | Templates, icons, and collaborative editing |
| Flourish | Interactive charts | Public sharing, map-based visuals |
| Adobe Illustrator | High-end design needs | Custom visuals, vector graphics |
5.4. Simplify Without Distorting
- Avoid data manipulation or misleading visuals.
- Include legends, sources, and scale bars.
5.5. Embed CTAs and Alt Texts
- Include QR codes or URLs to full papers.
- Provide alt-text for accessibility and SEO.
6. Common Mistakes to Avoid
- Overloading with Data: Cluttered visuals reduce clarity.
- Ignoring Accessibility: Colour blindness, screen readers must be considered.
- Misrepresentation: Graph truncation or disproportionate scaling can lead to misinformation.
- Neglecting Branding: Ensure consistent institutional or personal branding across visuals.
7. Recommendations for Researchers
- Start small: Begin with graphical abstracts or basic infographics.
- Collaborate: Work with institutional communication teams or freelance designers.
- Stay consistent: Develop a visual identity for all research outputs.
- Evaluate: Use analytics to assess engagement and adjust strategies.
Connect with us to explore how we can support you in maintaining academic integrity and enhancing the visibility of your research across the world!
Conclusion
Visual tools are now a prominent feature of today’s research dissemination. When designed intentionally and incorporated early in a workflow, these tools can help facilitate clarity, engagement, and citation. Researchers should add visual tools as a part of an intentional communication plan to ensure their work resonates beyond traditional audiences into academic and non-academic spaces.
Transform Your Research into High-Impact Visuals. Partner with Pubrica to create journal-ready graphical abstracts, infographics, and video explainers that enhance research visibility, reader engagement, and citation impact.
References
- Lazard, A., & Atkinson, L. (2015). Putting environmental infographics center stage: The role of visuals at the Elaboration Likelihood Model’s critical point of persuasion. Science Communication, 37(1), 6–33. https://doi.org/10.1177/1075547014555997
- Speich, B., Logullo, P., Deuster, S., Marian, I. R., Moschandreas, J., Taji Heravi, A., Gloy, V., Briel, M., Hopewell, S., & MAking Randomized Trials Affordable (MARTA) Group. (2021). A meta-research study revealed several challenges in obtaining placebos for investigator-initiated drug trials. Journal of Clinical Epidemiology, 131, 70–78. https://doi.org/10.1016/j.jclinepi.2020.11.007
- Olamoyegun, M. A., Alare, K., Afolabi, S. A., Aderinto, N., & Adeyemi, T. (2024). A systematic review and meta-analysis of the prevalence and risk factors of type 2 diabetes mellitus in Nigeria. Clinical Diabetes and Endocrinology, 10(1), 43. https://doi.org/10.1186/s40842-024-00209-1