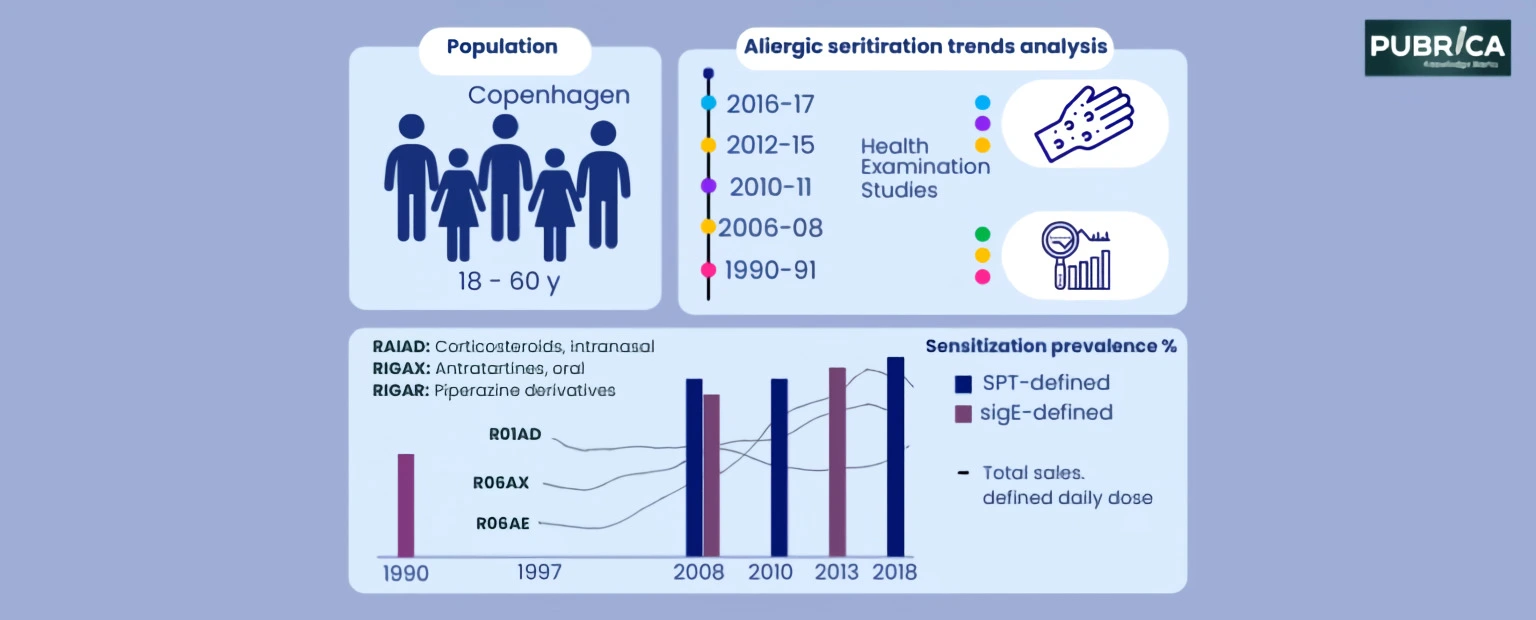
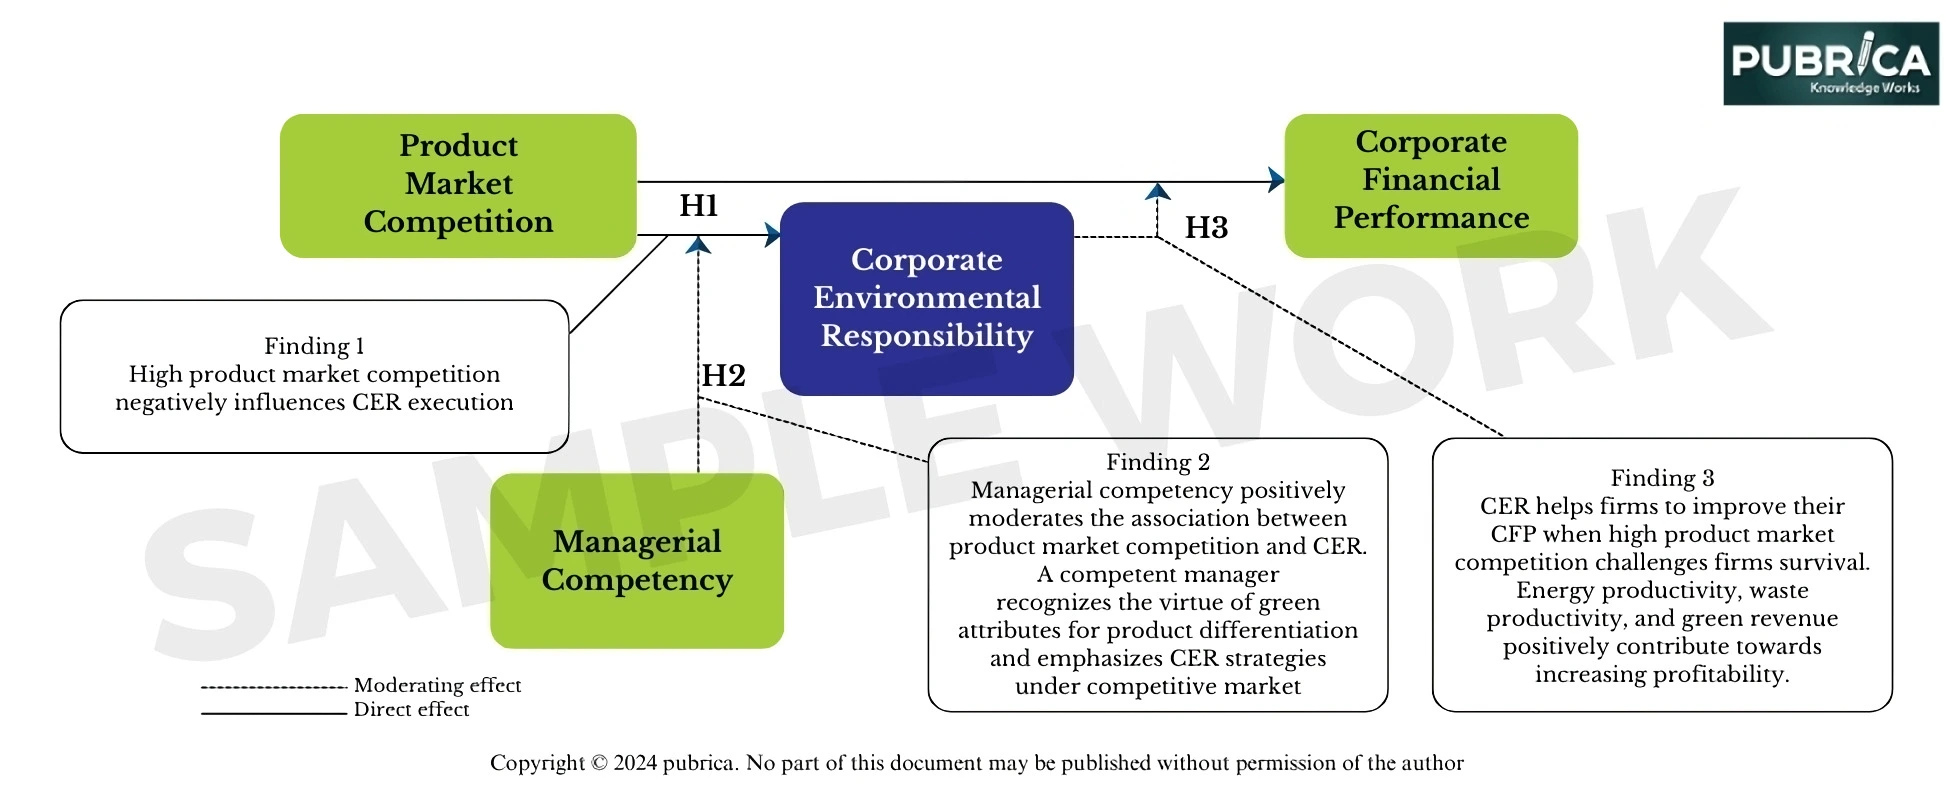
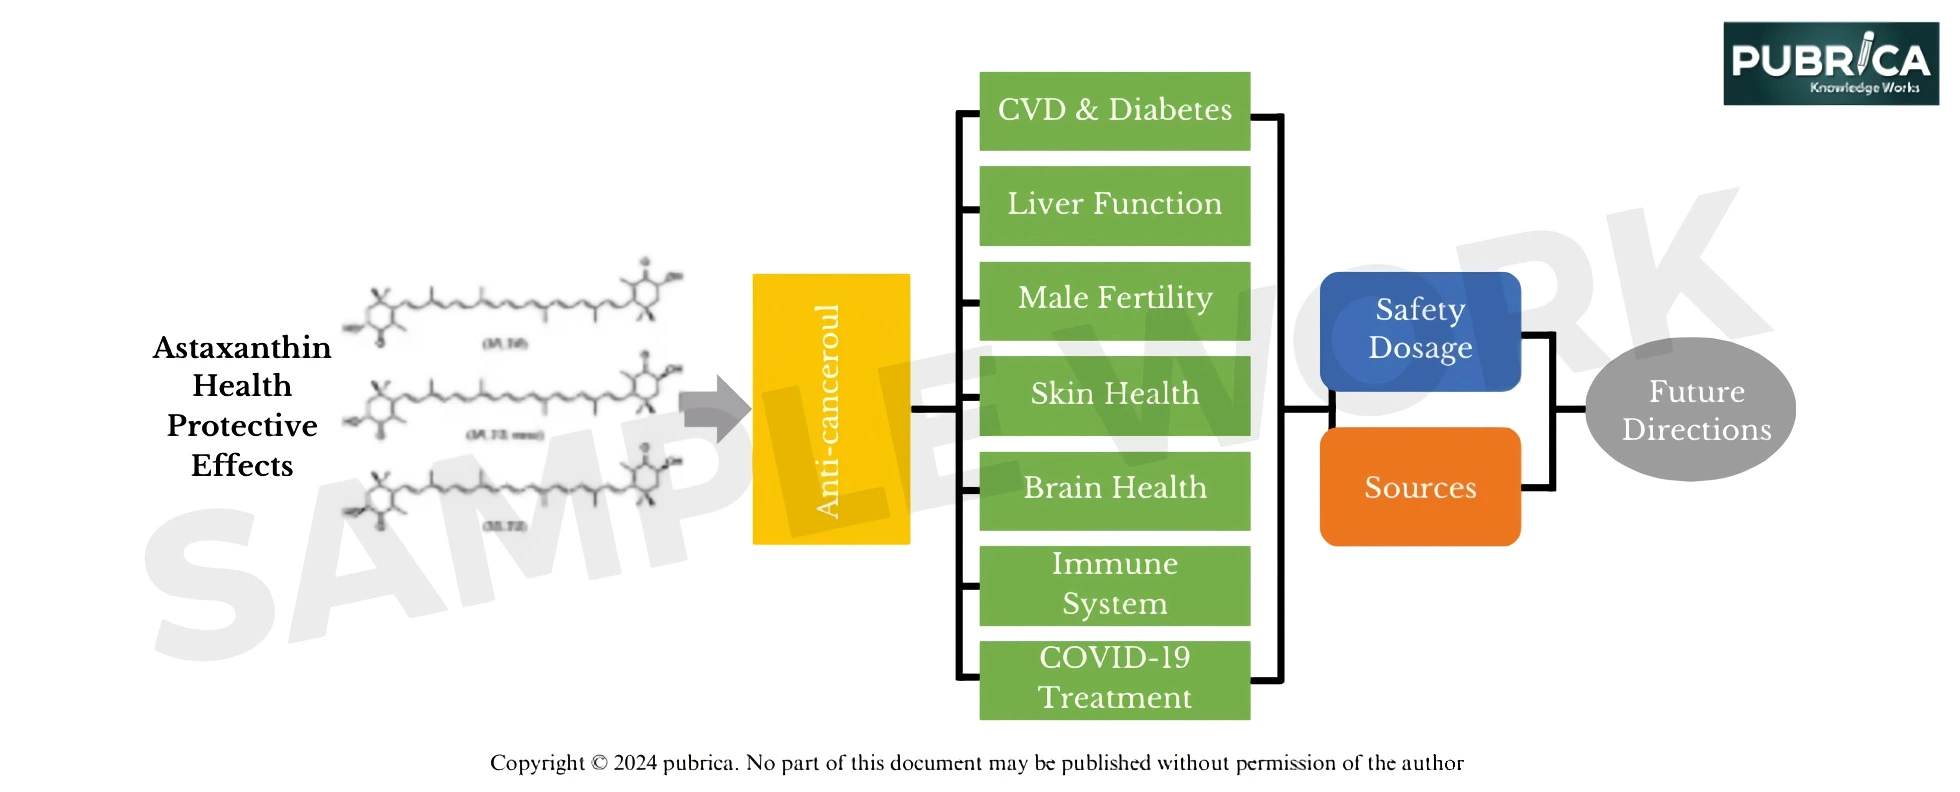
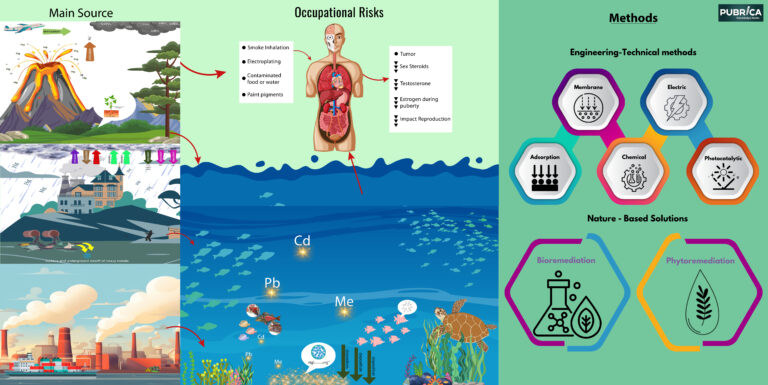
A graphical abstract serves as a visual summary of a paper’s abstract, facilitating audience understanding through visual depiction. Due to their growing popularity, many prestigious publishers and high-impact journals now require graphical abstracts. When submitting your paper, you may be requested to provide a visual abstract.
Graphical abstracts effectively summarize key research highlights, fostering reader engagement, increasing article visibility, and aiding in the comprehension of intricate findings, which resonates with contemporary communication preferences. Notably, vision comprises 87% of the five human senses, with color playing a significant role, accounting for 60% of vision.
“To ensure alignment with your research message, we kindly request your manuscript, details of your target journal, and basic information about your paper. Additionally, providing a reference sketch depicting your preferred layout or design would greatly assist us in creating the graphical abstract.”
“Providing a sketch helps us understand your preferred layout and style for the 3D graphical abstract, enabling us to align the first draft with your vision more accurately. Your feedback on the sketch ensures that the final product meets your expectations. If you provide a sketch, the turnaround time for either service will be reduced by two working days.”
At Pubrica, your satisfaction and success in publication are our primary concerns. Be assured that we remain committed to collaborating with you until you are completely satisfied with the graphical abstract delivered.
In a visual abstract, there are typically four key components: a captivating title, an engaging image, a succinct summary of research findings, and a compelling call to action. The title should be concise yet attention-grabbing, as the initial impression matters most. The image should be visually appealing and effectively represent the central research theme. The summary ought to be brief, focusing on the study’s key discoveries. Lastly, the call to action should motivate readers to delve into the original research article.
1. Infographic-style abstracts: These abstracts amalgamate diverse elements like text, graphics, and data visualizations such as charts.
2. Image-based abstracts: In this type, pivotal findings or concepts are conveyed through a single image or a series of photos. They prove particularly beneficial for research incorporating visual elements like microscopy or medical imaging.
3. Animated abstracts: These abstracts elucidate significant findings and concepts through animation or videos. They are ideal for research involving intricate mechanics or processes, as animated videos effectively convey such topics.
4. Interactive abstracts: Mainly used in data-intensive research, these abstracts enable viewers to interact with visual components. Viewers can zoom in on specific data points or explore various diagrams by clicking or hovering over the visual abstract.
Although there are subtle differences between these formats, they serve distinct purposes. A graphical abstract primarily highlights the conclusions and key findings of research, while an infographic aims to provide a broader narrative and visually depict data. However, the main contrast lies in the textual content: a graphical abstract typically contains minimal text, whereas an infographic inherently incorporates more textual material.
Your graphical abstract functions much like a movie poster, albeit with a teaser of the plot! Here’s how it enhances academic communication:
1. Enhanced accessibility: Graphical abstracts broaden the accessibility of complex research, catering to a wider and more diverse audience. Researchers across different fields, students, the general public, and policymakers can easily access and comprehend the latest research developments.
2. Social media dissemination: In an era where brevity is valued, graphical abstracts serve as bite-sized content ideal for sharing and resharing on social media platforms. This facilitates effective science communication, amplifying the visibility and impact of the research.
3. Image search compatibility: Graphical abstracts are compatible with image search functions of search engines. This expands the research’s reach beyond textual searches, enhancing its discoverability and accessibility.


