


What is Statistical Hypothesis?
- Home
- Academy
- Statistical analysis
- A Comparative Analysis of Systematic Reviews and Meta-Analyses in Biomedical Research
High-Impact Journals
- Concept Overview
- Definition of Statistical Hypothesis
- Importance of Statistical Hypothesis in Research
- Types of Statistical Hypotheses
- Process of Statistical Hypothesis Testing
- Common Statistical Tests Used
- Example of Statistical Hypothesis
- Key Concepts in Hypothesis Testing
- Challenges in Statistical Hypothesis Testing
- Conclusion
Interesting topics
What is Statistical Hypothesis?
Table of Contents
1. Concept Overview
2. Definition of Statistical Hypothesis
3. Importance of Statistical Hypothesis in Research
4. Types of Statistical Hypotheses
5. Process of Statistical Hypothesis Testing
6. Common Statistical Tests Used
7. Example of Statistical Hypothesis
8. Key Concepts in Hypothesis Testing
9. Challenges in Statistical Hypothesis Testing
10. Conclusion
Statistical hypothesis refers to the initial assumption made about the parameter of a certain population, which is tested using statistical hypothesis testing procedures through sample data. The hypothesis is important for quantitative research analysis in establishing the significance and chance occurrence of results in research. Hypothesis testing in statistics is an important tool that has found its use in medicine, business, psychology, economics, and social sciences among other areas.[1]
The statistical hypothesis acts as a scientific basis for analysing and validating the findings of the research. In making a hypothesis, the researchers develop assumptions before carrying out any research activity.
1. Concept Overview
2. Definition of Statistical Hypothesis
Statistical Hypothesis: It is the supposition about the parameter of the population that can be verified using statistics. There are two types of hypotheses:[2]
- Null Hypothesis (H₀): It states that there is no impact, difference, or relationship.
- Alternative Hypothesis (H₁/Ha): It states that there is an impact, difference, or relationship.
Example:
- H₀: New medicine does not affect patients.
- H₁: New medicine has a positive impact on patients.
3. Importance of Statistical Hypothesis in Research
Statistical hypotheses are very important because they assist researchers in:[3]
- Testing relationships among variables
- Verifying research hypotheses
- Evidence-based decision-making
- Bias-free research conclusions
- Identifying statistical significance in research
When conducting academic research, statistical hypothesis testing enhances the validity of the research and ensures rigorous quantitative research analysis.
4. Types of Statistical Hypotheses
Statistical hypotheses are generally classified into two major types:
| Type of Hypothesis | Description | Example |
| Null Hypothesis (H₀) | States that there is no relationship or difference between variables | Online learning does not affect student performance |
| Alternative Hypothesis (H₁) | States that a relationship or difference exists | Online learning improves student performance |
The null hypothesis is tested statistically, while the alternative hypothesis is accepted if sufficient evidence exists against the null hypothesis.
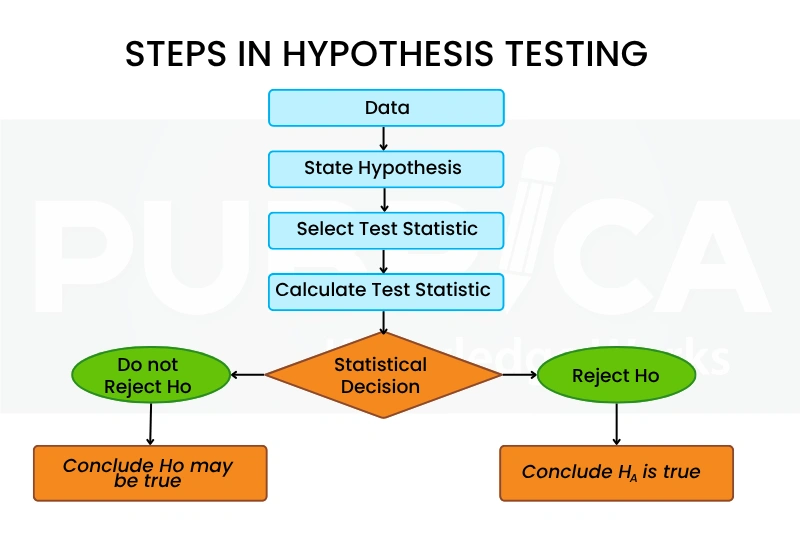
5. Process of Statistical Hypothesis Testing
Hypothesis testing in statistics is normally done by following a definite procedure as follows:[4]
- State the research problem
- Develop hypotheses
- Sample collection
- Select a statistical test
- Data analysis
- Result interpretation
- Conclusion about the hypotheses
The above procedure guarantees scientific correctness when conducting quantitative research analysis.
6. Common Statistical Tests Used
Different statistical tests are used depending on the research design and data type.
| Statistical Test | Purpose | Example Application |
| T-Test | Compare two groups | Male vs female performance |
| ANOVA | Compare multiple groups | Comparing teaching methods |
| Chi-Square Test | Analyse categorical relationships | Smoking and disease association |
| Correlation Analysis | Measure relationship strength | Stress and academic scores |
| Regression Analysis | Predict relationships | Sales prediction analysis |
Researchers commonly use software such as SPSS statistical analysis, R, Python, and Excel for statistical hypothesis testing.
7. Example of Statistical Hypothesis
Research Topic: Impact of Social Media on Academic Performance
- Null Hypothesis (H₀): Social media usage has no significant impact on academic performance.
- Alternative Hypothesis (H₁): Social media usage significantly affects academic performance.
Researchers collect data from students and apply statistical methods in research to determine whether the relationship is statistically significant in research.[5]
8. Key Concepts in Hypothesis Testing
|
Significance Level (α) |
The probability threshold used to reject the null hypothesis, commonly set at 0.05.
|
|||
|
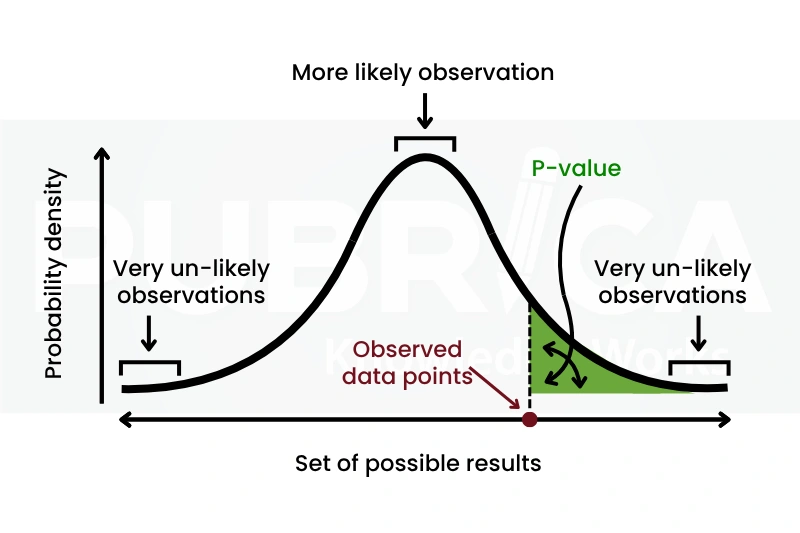
2. P-Value
|
Indicates whether research findings are statistically significant.
|
|||
|
Type I and Type II Errors |
|
Understanding these concepts is essential for accurate quantitative research analysis and interpretation.
9. Challenges in Statistical Hypothesis Testing
There may be several difficulties encountered by researchers when performing hypothesis testing in statistics:
- Choosing an appropriate test statistic
- Small sample sizes
- Quality of data
- Wrong interpretation of the p-value
- Assumption violations of statistical tests.
Connect with us to explore how we can support you in maintaining academic integrity and enhancing the visibility of your research across the world!
Conclusion
The concept of a statistical hypothesis is essential in the world of quantitative research analysis. Using this tool enables researchers to carry out scientific evaluation of their assumptions and relationships through statistical hypothesis testing. Proper selection of hypotheses, use of appropriate tests, and result interpretation will ensure that research findings gain greater acceptance in academia.
Correct hypothesis testing in statistics not only improves research output but also assists with making sound decisions in other sectors including sciences, medicine, and business.
What is a Statistical Hypothesis? Our Pubrica consultants are here to guide you. [Get Expert Publishing Support] or [Schedule a Free Consultation]
References
- Shreffler J, Huecker MR. Hypothesis Testing, P Values, Confidence Intervals, and Significance. [Updated 2023 Mar 13]. In: StatPearls [Internet]. Treasure Island (FL): StatPearls Publishing; 2026 Jan-. Available from: https://www.ncbi.nlm.nih.gov/
- Ranganathan, P., & Cs, P. (2019). An Introduction to Statistics: Understanding Hypothesis Testing and Statistical Errors. Indian journal of critical care medicine : peer-reviewed, official publication of Indian Society of Critical Care Medicine, 23(Suppl 3), S230–S231. https://doi.org/10.5005/jp-journals-10071-23259
- Pugh, S. L., & Molinaro, A. (2016). The nuts and bolts of hypothesis testing. Neuro-oncology practice, 3(3), 139–144. https://doi.org/10.1093/nop/
- Kim, J., Kim, D. H., & Kwak, S. G. (2024). Comprehensive guidelines for appropriate statistical analysis methods in research. Korean journal of anesthesiology, 77(5), 503–517. https://doi.org/10.4097/kja.24
- Shreffler J, Huecker MR. Type I and Type II Errors and Statistical Power. [Updated 2023 Mar 13]. In: StatPearls [Internet]. Treasure Island (FL): StatPearls Publishing; 2026 Jan-. Available from: https://www.ncbi.nlm.nih.gov/