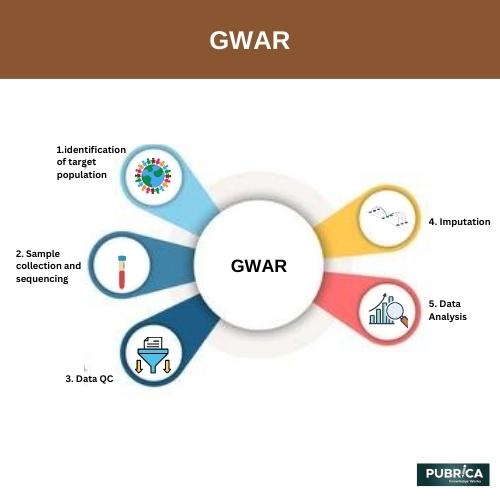
GWAR Framework: A Comprehensive Guide to Effective Analysis
GWAR (Genome-Wide Association Studies Robust analysis and meta-analysis) is a powerful and comprehensive approach for analyzing and performing meta-analyses of genome-wide association studies (GWAS). It is designed to extract valuable insights from large-scale genetic datasets and identify genetic variants associated with complex traits or diseases.
Key Features of GWAR:
- Meta-analysis Integration: GWAR allows for the integration of multiple GWAS datasets, combining their biostatistical results to increase sample size and statistical power. This integration enhances the ability to detect genetic variants that contribute to the trait or disease under investigation.
- Quality Control: GWAR includes rigorous quality control measures to ensure the reliability and consistency of the data. It assesses the quality of individual GWAS studies, including sample exclusions, genotyping quality, and population stratification. By filtering out low-quality data, GWAR enhances the accuracy and validity of the analysis.
- Statistical Analysis: GWAR employs advanced statistical methods to identify genetic variants associated with the trait or disease of interest. It employs logistic regression, linear regression, or other appropriate statistical models to assess the association between genetic markers and the phenotype.

- Adjustment for Confounders: GWAR takes into account potential confounding factors that can influence the association between genetic variants and traits. It allows for adjustment of covariates such as age, sex, ethnicity, or other relevant variables to minimize their impact on the analysis results.
- Meta-analysis Methods: GWAR utilizes various meta-analysis methods, including fixed-effects models and random-effects models, to combine the results from different GWAS studies. These methods account for heterogeneity across studies and provide robust genetic effect size and significance estimates.
- Multiple Testing Correction: GWAR incorporates correction methods, such as Bonferroni correction or false discovery rate (FDR) adjustment, to account for multiple comparisons and control for false-positive associations. This helps to ensure that the reported associations are statistically significant and robust.
- Visualization and Interpretation: GWAR provides tools for visualizing and interpreting the meta-analysis results. It generates graphical representations, such as Manhattan plots or Q-Q plots, which aid in identifying genomic regions associated with the trait or disease. These visualizations help researchers better understand the genetic architecture underlying the studied phenotype.
GWAR is a valuable tool for researchers in the field of genetics and genomics, enabling them to conduct comprehensive analyses and meta-analyses of GWAS data. It aids in identifying genetic variants linked to complex traits and diseases, advancing our understanding of the genetic basis of various phenotypes.
References
Dimou, Niki L., et al. “GWAR: robust analysis and meta-analysis of genome-wide association studies.” Bioinformatics 33.10 (2017): 1521-1527.
