Understanding Funnel Plots: A Key Tool in Meta-Analysis


Dr.Nancy | Research design and Mixed Methods Research.
19 Jan, 2025

Dr.Nancy | Research design and Mixed Methods Research. 19 Jan, 2025
Introduction
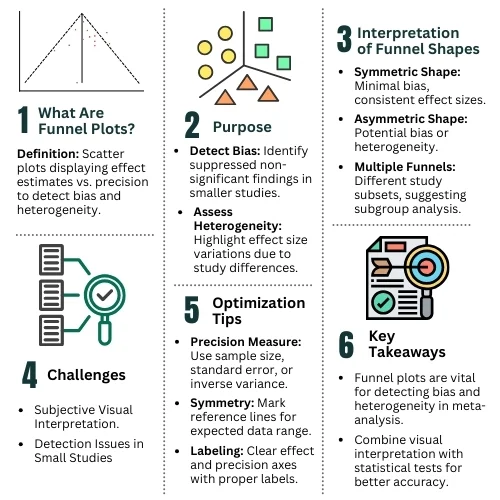
What Are Funnel Plots and Why Are They Useful?

Interpreting Funnel Plot Patterns
- Symmetric Funnel Shape
- Indicates consistent effect sizes across studies of varying precision.
- Suggests minimal bias and homogeneity in the underlying data [3].
- Asymmetric Funnel Shape
Implies a potential relationship between effect size and study precision, often due to [4]:
- Reporting Bias: Smaller studies with non-significant results may not be published.
- Heterogeneity: Differences in study populations or methodologies.
- Chance or Other Biases: Variations in effect measures or study inclusion criteria.
- Multiple Symmetric Funnels
- Suggests subsets of studies with differing underlying effects, which may warrant subgroup analysis.
Challenges with Funnel Plots
- Visual Interpretation: “Eyeballing” plots can be subjective and prone to bias.
- Publication Bias Detection: Not always reliable, especially for studies of similar size or precision.
Optimizing Funnel Plots for Precision
1.Choosing the Right Measure of Precision
- Common measures include total sample size, standard error, or inverse variance.
- Sterne and Egger recommend using standard error for its simplicity and reliability [6].
2. Defining Symmetry
- Use straight reference lines to delineate regions where 95% of data points are expected to lie, assuming no heterogeneity or bias [7].
3. Labeling and Scaling
- Effect measures should appear on the horizontal axis, while precision metrics occupy the vertical axis [2].
- Ensure clear labels, scales, and legends for easy interpretation.
Contact us today to elevate your research with expert visualization and statistical analysis.
We offer the expertise, knowledge, and comprehensive support your Clinical research and publication needs.
How Pubrica Assists Researchers with Funnel Plots
- Expert Plot Design
We tailor funnel plots to your specific dataset, ensuring clarity and accuracy.
Our visualizations follow established guidelines, such as PRISMA and Cochrane recommendations.
- Advanced Statistical Support
Our statisticians perform rigorous analyses to detect bias and heterogeneity.
We use complementary statistical tests, like Egger’s or Begg’s tests, to validate funnel plot findings.
- Customization for Publications
We optimize plots for journal requirements, including precise labeling and annotations.
Supplementary materials, such as detailed tables or statistical summaries, are also provided.
- Training and Guidance
Pubrica offers training sessions on interpreting funnel plots, enabling researchers to extract actionable insights.
