
Mean and Mean difference are the two key statistical measures used in the statistical analysis. Both are essential for meta-analysis as well. Mean and Mean difference are used for the interpretation of a large set of values into a single number which explains the heterogeneity and variation among the individual values. However, one of a common challenge in meta-analysis is the unavailability of this data (mean and standard deviation).
Q & A Forum
Meta Analysis
Q: What is the good confidence interval that I can expect in Meta Analysis?

Confidence interval:
A confidence interval is an interval that gives a range for observed data within which the population parameter falls. It is related to the level of confidence which depicts the precision of confidence level.
Individual studies and meta-analyses are usually presented with a point estimate with an associated confidence interval (CI).
Calculation of confidence intervals:
CI = Sample mean ± z value × (Standard deviation/√n)
Example: We take the data from a randomized controlled study Bolke L, Schlippe G, Gerß J, et al. [2] for calculating the confidence interval of mean estimate of collagen supplement for skin elasticity after 12 weeks. The mean estimate for skin elasticity of intervention group after 12 weeks is 0.81. Standard deviation is 0.04 and sample size is 36 from the study.
Table.1 Data extracted from Bolke L, Schlippe G, Gerß J, et al. [2] study
Measurement | Groups | Cases | Baseline | 12 weeks |
Skin elasticity | Intervention | 36 | 0.69 ± 0.05 | 0.81 ± 0.04 |
control | 36 | 0.71 ± 0.06 | 0.75 ± 0.06 |
Sample mean: 36
Z value (95% CI): 1.95996
SD: 0.04
√n: 6
Insert the values into the formula,
CI= 36 ± 1.95996 × (0.04/6)
= 36 ± 0.013
CI= 35.987 to 36.013
So, the 95% confidence interval for the mean of intervention group after 12 weeks is 35.987 to 36.013.
Table.2 Data from Hazra A. [1] study
Confidence level | Z value |
50% | 0.67449 |
75% | 1.15035 |
90% | 1.64485 |
95% | 1.95996 |
97% | 2.17009 |
99% | 2.57583 |
99.9% | 3.29053 |
Connect with us to explore how we can support you in maintaining academic integrity and enhancing the visibility of your research across the world!
Nutrients, 15(9), Article 2080. https://doi.org/10.3390/nu15092080
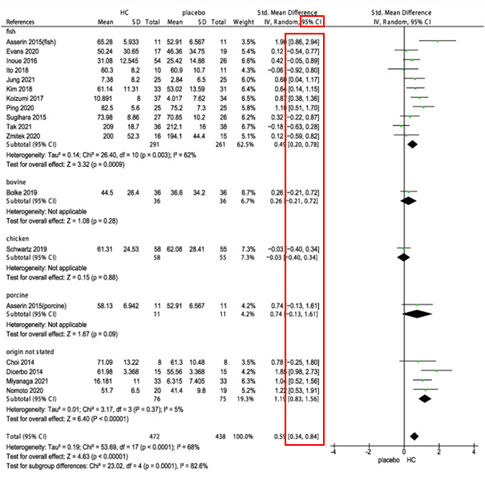
In this image, the 95% confidence interval is used to state the degree of uncertainty in a meta-analysis for the efficacy of collagen supplementation on skin aging
The confidence interval depicts the degree of uncertainty in this mean estimate, presenting a range in which the population parameter would probably fall.
If the CI is narrow, the value is more accurate. A wider CI reflects increased uncertainty, yet it could still offer good insights.
Extremely wider ranges imply a significant uncertainty, inhibiting efforts to reach better conclusions without further details.
Factors Affecting Confidence Interval:
- More intensive studies produce more accurate values, resulting in narrow CI.
- For continuous results, precision is influenced by variability (standard deviation). For dichotomous results, it relies on risk ratio, for time-to-event results, it depends on the count of observed samples.
- In meta-analyses, the range of the CI relies on the precision of the included studies and the number of studies included.
- In a random-effects model, higher variability results in wider confidence intervals, decreasing precision. [1]
90% Confidence Interval:
- lower than 95% intervals, result in decreasing uncertainty but a higher chance of overpowering the true effect size. It can be suitable for exploratory research or when researchers tend to tolerate a greater risk of error.
95% Confidence Interval:
- The extreme statistical interpretation implies that if the study were conducted a multiple number of times, 95% of the occurred confidence intervals would capsulate the true effect.
- 95% confidence interval helps identify the variations in I² estimates.
99% Confidence Interval:
- Intervals higher than 95% reflect an increased degree of confidence in the point estimate. They are useful when higher confidence is required, even if this results in reduced precision of the point estimate. [3][4]
Conclusion:
- A 95% confidence interval is usually seen as a better choice for meta-analysis, as it produces a strong basis for assessing the precision of point estimates while keeping an equilibrium with the requirement for statistical rigor.
- 95 % Confidence interval is the most used confidence interval in randomized controlled trials.
References:
- Hazra A. Using the confidence interval confidently. J Thorac Dis. 2017;9(10):4125-4130. doi:10.21037/jtd.2017.09.14.
- Bolke L, Schlippe G, Gerß J, et al. A collagen supplement improves skin hydration, elasticity, roughness, and density: results of a randomized, placebo-controlled, blind study. 2019;11(10):2494. doi:10.3390/nu11102494
- https://handbook-5-1.cochrane.org/chapter_12/12_4_1_confidence_intervals.htm
- Thorlund K, Imberger G, Johnston BC, et al. Evolution of heterogeneity (I²) estimates and their 95% confidence intervals in large meta-analyses. PLoS One. 2012;7(7):e39471. doi:10.1371/journal.pone.0039471.
- Pu S-Y, Huang Y-L, Pu C-M, et al. Effects of oral collagen for skin anti-aging: A systematic review and meta-analysis. Nutrients. 2023;15(9):2080. doi:10.3390/nu15092080.