

Statistical significance explains if there is a treatment effect exists or not while the effect size shows how large the effect exists. Statistical significance tells whether it occurred by chance or truly has an interventional effect.
Q & A Forum
Meta Analysis
Statistical significance explains if there is a treatment effect exists or not while the effect size shows how large the effect exists. Statistical significance tells whether it occurred by chance or truly has an interventional effect.
Effect size is considered as the practical significance which compares the mean difference between two groups is considered rather than sample size. Statistical significance is greatly influenced by sample sizes.
Effect size, statistical power, sample size, and significance level are closely linked in hypothesis testing.
In meta-analysis, researchers examine effect sizes across multiple studies and integrate them into a comprehensive analysis. Effect sizes serve as the raw data since they are standardized and easily comparable. By combining effect sizes from multiple related studies, a meta-analysis provides an estimate of the average effect size for a particular finding.[3]
Calculation:
We can calculate the effect size by many methods. But the commonly used method is Cohen’s D.
Cohen’s D:
Cohen’s d is used to compare two groups by measuring the difference between their means in terms of standard deviation units. It indicates how many standard deviations separate the two means.
d= (X1-X2) / S
Where,
X1– Mean difference of population 1
X2- Mean difference of population 2
S- pooled standard deviation
In Meta-analysis the average data is calculated in the same way, but studies with less standard deviation gets more weightage than the higher standard deviation. The precision of the mean value is estimated by standard error of the mean. The standard error of the mean is lesser when the standard deviation is less. The smaller the SEM the higher the precision of the mean value.
Example: we take the data from a randomized controlled study Bolke L, Schlippe G, Gerß J, et al. [3] for assessing the effect size collagen supplement for skin hydration. The mean estimate for skin hydration is 35.0 and 33.7 for intervention and control group at baseline. The mean after 12 weeks treatment is 44.5 and 36.6 for intervention and control group respectively. Standard deviation is 4.4 and 5.7 for intervention and control group.
Table.1 Data extracted from Bolke L, Schlippe G, Gerß J, et al. [4] study
Measurement | Groups | Cases | Baseline | 12 weeks |
Skin hydration | Intervention | 36 | 35.0 ± 4.8 AU | 44.5 ± 4.4 AU |
control | 36 | 33.7 ± 5.1 AU | 36.6 ± 5.7 AU |
d= (X1-X2) / S
X1-9.5
X2- 2.9
S – 2.24
Now applying the values, we get
d= (X1-X2) / S
= 9.5- 2.9 / 2.24 = 2.95
d = 2.95
so, the effect size of collagen supplement on improving the skin hydration parameter is 2.95 from this study.
Effect sizes are classified as small, medium, or large based on Cohen’s criteria, which vary depending on the effect size measure used.
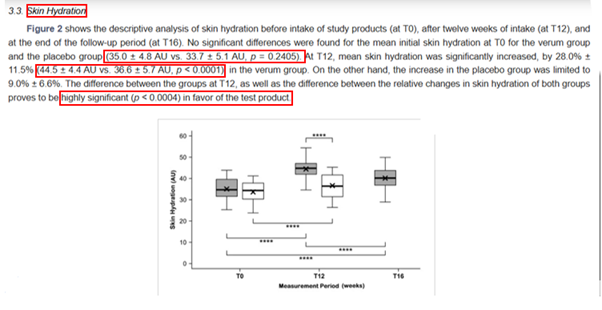
Figure.1 from the Bolke L, Schlippe G, Gerß J, et al. [4] study Illustrate the statistical significance of difference between intervention and control groups after treatment in skin hydration