

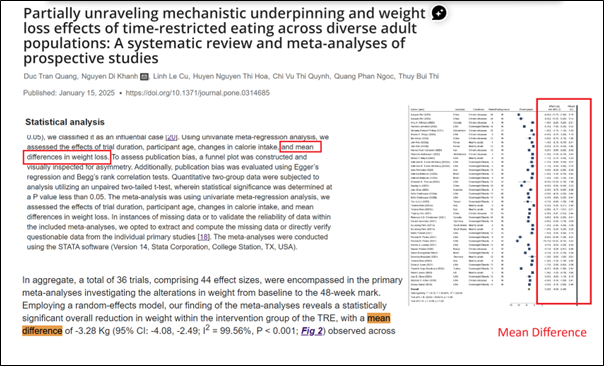
Mean and Mean difference are the two key statistical measures used in the statistical analysis. Both are essential for meta-analysis as well. Mean and Mean difference are used for the interpretation of a large set of values into a single number which explains the heterogeneity and variation among the individual values. However, one of a common challenge in meta-analysis is the unavailability of this data (mean and standard deviation).
Q & A Forum
Meta Analysis
Mean and Mean difference are the two key statistical measures used in the statistical analysis. Both are essential for meta-analysis as well. Mean and Mean difference are used for the interpretation of a large set of values into a single number which explains the heterogeneity and variation among the individual values. However, one of a common challenge in meta-analysis is the unavailability of this data (mean and standard deviation).
Mean is the average value that is obtained by pooled estimation of group of data with same measurement units.
In Meta-analysis the average data is calculated in the same way, but studies with less standard deviation gets more weightage than the higher standard deviation. The precision of the mean value is estimated by standard error of the mean. The standard error of the mean is lesser when the standard deviation is less. The smaller the SEM the higher the precision of the mean value.
In Meta-analysis the average data is calculated in the same way, but studies with less standard deviation gets more weightage than the higher standard deviation. The precision of the mean value is estimated by standard error of the mean. The standard error of the mean is lesser when the standard deviation is less. The smaller the SEM the higher the precision of the mean value.
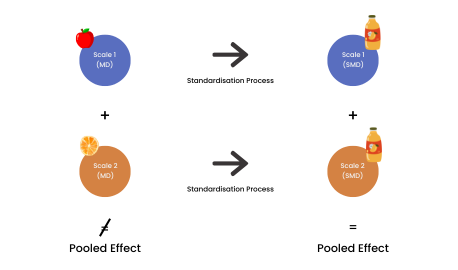
The standardized mean difference (SMD) is used as a summary statistic in meta-analysis when different studies evaluate the same outcome but employ different measurement methods (e.g., various psychometric scales to assess depression). In such cases, standardizing the results onto a common scale is essential before they can be pooled together. The SMD represents the magnitude of the intervention effect in each study relative to the observed variability within that study. Importantly, the actual intervention effect is reflected as a difference in means rather than the mean of differences.
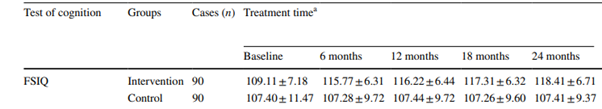
Table.1 Data extracted from Ma et al [3]
Measurement | Groups | Cases | Baseline | 24 months |
Full scale IQ | Intervention | 90 | 109.11 ± 7.18 | 118.41 ± 6.71 |
control | 90 | 107.40 ± 11.47 | 107.41 ± 9.37 |
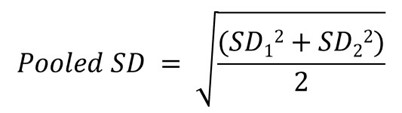
Apply the values in this formula
= √6.71+9.37/2= √8.04 = 2.83
Pooled standard deviation= 2.83
Now we can insert all the values in standard mean difference formula,
SMD= Difference between clozapine and haloperidol group/Pooled standard deviation
SMD= 9.3-0.01/2.83 = 3.28
Finally, we get the SMD value 3.28 for this study. In the same way we can calculate SMD for all the studies and compare them in meta-analysis. [3]